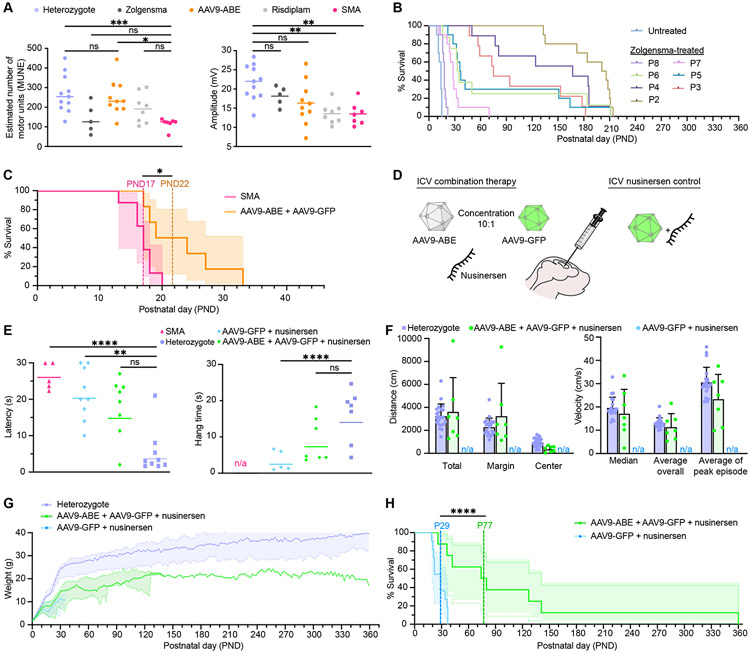
Fig. 4. AAV9-ABE mediated rescue of Δ7SMA mice.
(A) (Left) Motor unit number estimation (MUNE) and (Right) compound muscle action potential (CMAP) amplitude at PND12 in heterozygotes (n=11), and Δ7SMA mice treated with Zolgensma (n=5), AAV9-ABE (n=10), risdiplam (n=8), or uninjected (n=7). (B) Kaplan–Meier curve of Δ7SMA neonates ICV injected with Zolgensma from Robbins et al. 2014 (data extracted using PlotDigitizer). Average (av), median (md), and longest (lng) survival in days: untreated (avg-13, med-14, lng-15), PND2 (avg-187, med-204, lng-214), PND3 (avg-102, med-75, lng-182), PND4 (avg-141, med-167, lng-211), PND5 (avg-76, med-37, lng-211), PND6 (avg-73, med-34, lng-211), PND7 (avg-30, med-28, lng-70), and PND8 (avg-18, med-18, lng-22).). (C) Kaplan-Meier curve in AAV9-ABE treated (n=6) and uninjected (n=8) Δ7SMA mice. (D) Neonatal ICV co-injections with AAV9-ABE, AAV9-GFP, and nusinersen. (E) (Left) The time required for Δ7SMA mice to right themselves in the righting reflex assay at PND7. (Right) The hang time of Δ7SMA mice in the inverted screen test at PND25. (F) Analysis of voluntary movement by open field tracking at PND40. (Left) Traveled distance in cm. (Right) Velocity in cm/s. (G, H) Body weight in grams and Kaplan-Meier curve of Δ7SMA mice. Graph line shading represents (G) standard deviation or (H) 95% CI. Animals are treated as indicated. Dots represent individual animals, *≤0.02, **≤0.01, ***≤0.005, ****≤0.001.

