
Figure 3.
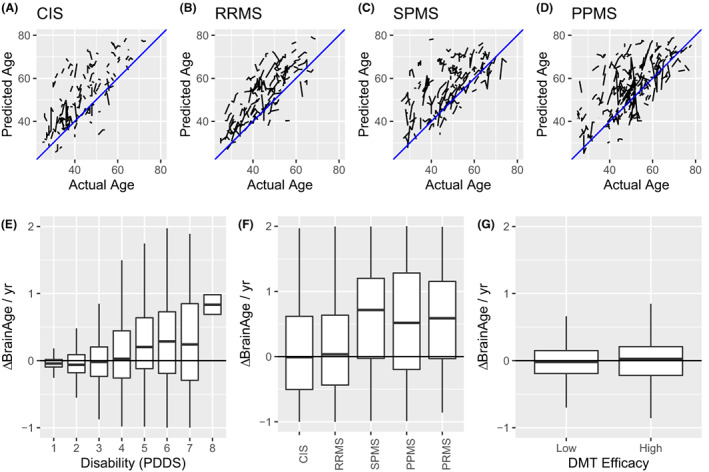
Longitudinal changes in brain age are related to disability. Longitudinally predicted brain age by BrainAgeR is shown as spaghetti plots for CIS (A), RRMS (B), SPMS (C), and PPMS (D) participants. In each case, predicted age over‐estimates actual age and single subjects demonstrate increasing predicted brain age with increasing actual age. To facilitate visualization, only a randomly selected fraction of the total data are shown for purpose of illustration; all subjects are considered statistically. Next, the longitudinal marginal rate of change in predicted brain age was calculated for each subject and expressed as change in predicted brain age (ΔBrainAge) per actual year attributable to PDDS (E), MS disease course (F), and DMT efficacy (G). Higher disability was associated with accelerated brain aging.