
Figure 2.
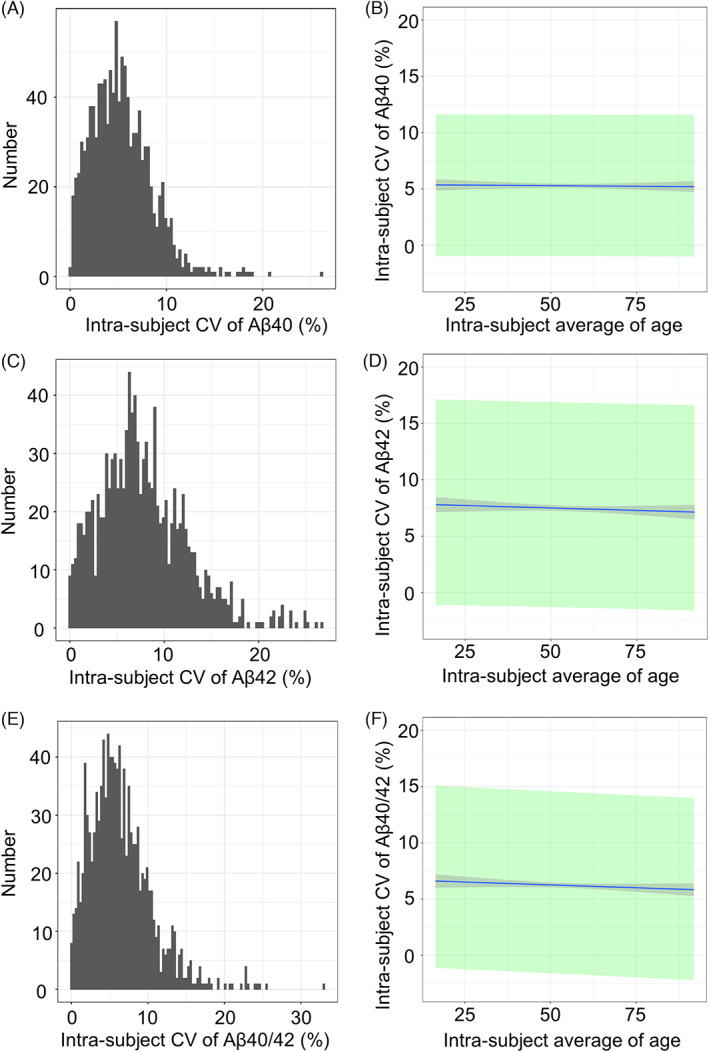
Inter‐subject CV of longitudinal measurements of plasma Aβ. CV, coefficient of variation; Aβ, amyloid‐beta. Distribution histograms of values for the coefficient of variations (CV) of Aβ40 levels (A), Aβ42 levels (C), and the Aβ40/42 ratio (E). The regression lines between the intra‐subject average of age and intra‐subject CV of Aβ (B), Aβ42 (D), and the Aβ40/42 ratio (F). The gray area indicates the 95% confidence interval (CI) of regression lines, while the green area shows the 95% prediction interval. The means and SD of CV were 5.32 ± 3.20% (95% CI: 5.13–5.51%) for Aß40, 7.78 ± 4.63% (95% CI: 7.51–8.05%) for Aß42, and 6.43 ± 4.12% (95% CI: 6.19–6.67%) for the Aß40/42 ratio. The 2SD upper limits of individual annual CVs were 11.71% for Aß40, 17.04% for Aß42, and 14.67% for the Aß40/42 ratio. No significant age‐dependent changes were observed in Aβ40 (Fig. 2B, regression equation; Y = −0.001X + 5.35, coefficient of determination; r 2 < 0.001, P = 0.930), Aβ42 (Fig. 2D, Y = −0.008X + 8.19, r 2 < 0.001, P = 0.407), or the Aβ40/42 ratio (Fig. 2F, Y = −0.02X + 7.25, r 2 = 0.003, P = 0.066).