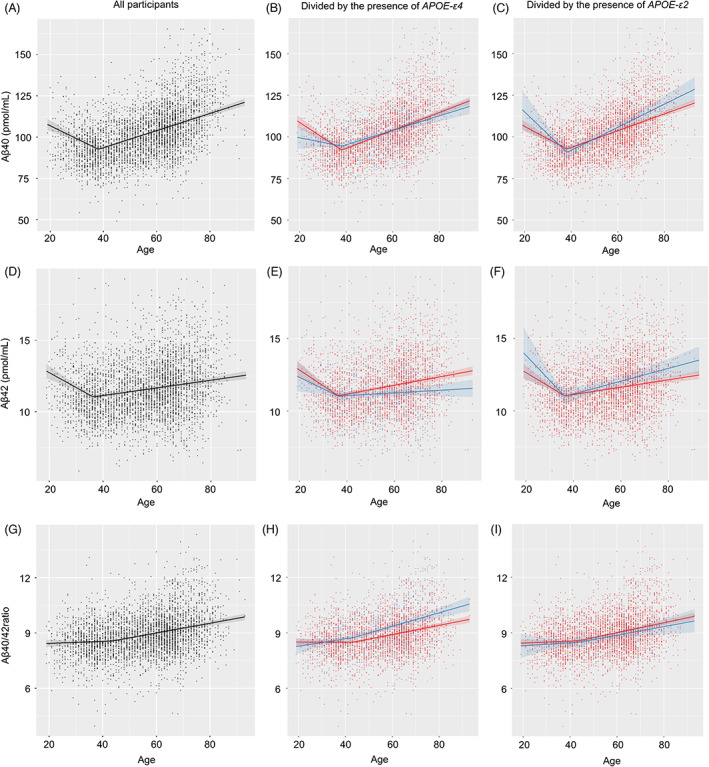
Figure 3.

Change point analysis of Aß levels in the presence of APOE‐ε4 and APOE‐ε2. Black plots and lines indicate all subjects. Blue indicates APOE‐ε4 or APOE‐ε2 carriers, while red shows the corresponding non‐carriers. All samples for the entire year are plotted. Lines indicate regression lines and the 95% confidence intervals of regression lines. Plasma Aβ40 levels decreased until 38.2 years and then increased (A). Plasma Aβ42 levels decreased until 36.4 years and then increased (D). The plasma Aβ40/42 ratio increased until 43.5 years and then showed enhanced age‐dependent increases (G). Decreases in Aβ40 levels with aging were attenuated in the presence of APOE‐ε4 until 38.2 years (B). Aβ42 levels were not affected by APOE‐ε4 before or after 36.4 years (E). The increase in the Aβ40/42 ratio after 43.5 years was enhanced in the presence of APOE‐ε4 (H). APOE‐ε2 did not affect age‐dependent changes in Aβ40, Aβ42, or the Aβ40/42 ratio before or after each change point (C, F, I).
