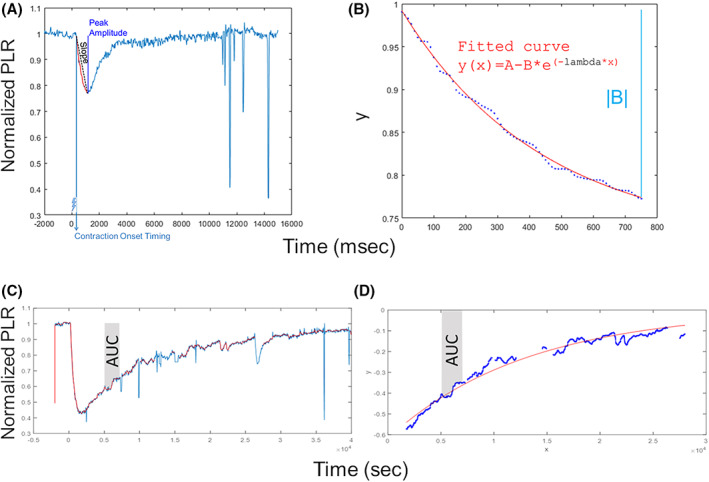
Figure 1.

Chromatic pupillometry data analysis metrics. For rod‐condition (panels A and B), on the left, it is shown an example of normalized PLR trace (azure line) and the relative contraction onset timing and average slope calculated parameters; on the right, it is shown an example of fitted PLR curve (red curve) by using the exponential function of the form y = A – B * e (−lambda * x), where A is a constant, lambda is the constriction velocity, x is time in ms. For mRGC‐condition (panels C and D), on the left, it is shown an example of raw PLR trace (azure line) and of normalized PLR trace (red line); on the right, it is shown an example of exponential fitted curve (red curve) during the PLR re‐dilation phase. In both plots, the AUC during 5–7 s time interval from light‐stimulus offset is shown in gray shadow.
