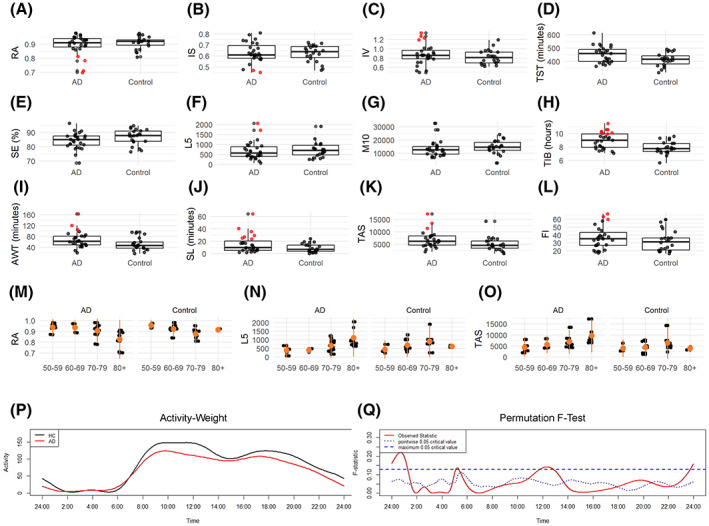
Figure 5.

Actigraphy results. Panels A–L show boxplots of actigraphic measures for each comparison group (AD, Alzheimer's disease/control) with the horizontal line represents the median value and red plots corresponding to patients resulted as circadian‐impaired [AD cases with circadian values >2 SD from the mean of controls, as previously proposed by Hatfield et al. 45 ]. Panels M–O show scatterplots of RA, L5, TAS actigraphic measures relative to AD and controls across age decades: 50–59 years; 60–69 years; 70–79 years, ≥80 years. In particular, β coefficients for the controls: RA: β 60–69 years = −0.05 (95% CI = −0.1 to −0.01); β 70–79 years = −0.09 (95% CI = −0.1 to −0.05); β ≥80 years = −0.05 (95% CI = −0.11 to 0.01). L5: β 60–69 years = 451 (95% CI = −12 to 914); β 70–79 years = 611 (95% CI = 153–1069); β ≥80 years = 259 (95% CI = −349 to 867). TAS: β 60–69 years = 1843 (95% CI = −1597 to 5283); β 70–79 years = 3362 (95% CI = −41 to 6765); β ≥80 years = 405 (95% CI = −4110 to 4920). β coefficients for AD: RA: β 60–69 years = 0.01 (95% CI = −0.07 to 0.09); β 70–79 years = −0.04 (95% CI = −0.1 to 0.03); β ≥80 years = −0.12 (95% CI = −0.2 to −0.05). L5: β 60–69 years = −36 (95% CI = −548 to 476); β 70–79 years = 295 (95% CI = −109 to 698); β ≥80 years = 779 (95% CI = 329–1228). TAS: β 60–69 years = 799 (95% CI = −3057 to 4655); β 70–79 years = 2791 (95% CI = −248 to 5830); β ≥80 years = 5850 (95% CI = 2467–9234). Panel P: Circadian motor activity profile of AD patients (Red) and controls (Black). Panel Q: Results of the non‐parametric permutation F‐test. Significant differences are detected when the red solid line (i.e., observed statistic) is above the blue dotted line (i.e., the point‐wise test of significance at α = 0.05) or the blue dashed line (i.e., the global test of significance at α = 0.05, more conservative). AWT, actual wake time; FI, fragmentation index; IS, interdaily stability; IV, intradaily variability; L5, least 5 average, activity for least 5 active hours; M10, most 10 average, activity during most 10 active hours; RA, relative amplitude; SE, sleep efficiency; SL, sleep latency; TAS, total activity score; TIB, time in bed; TST, total sleep time.
