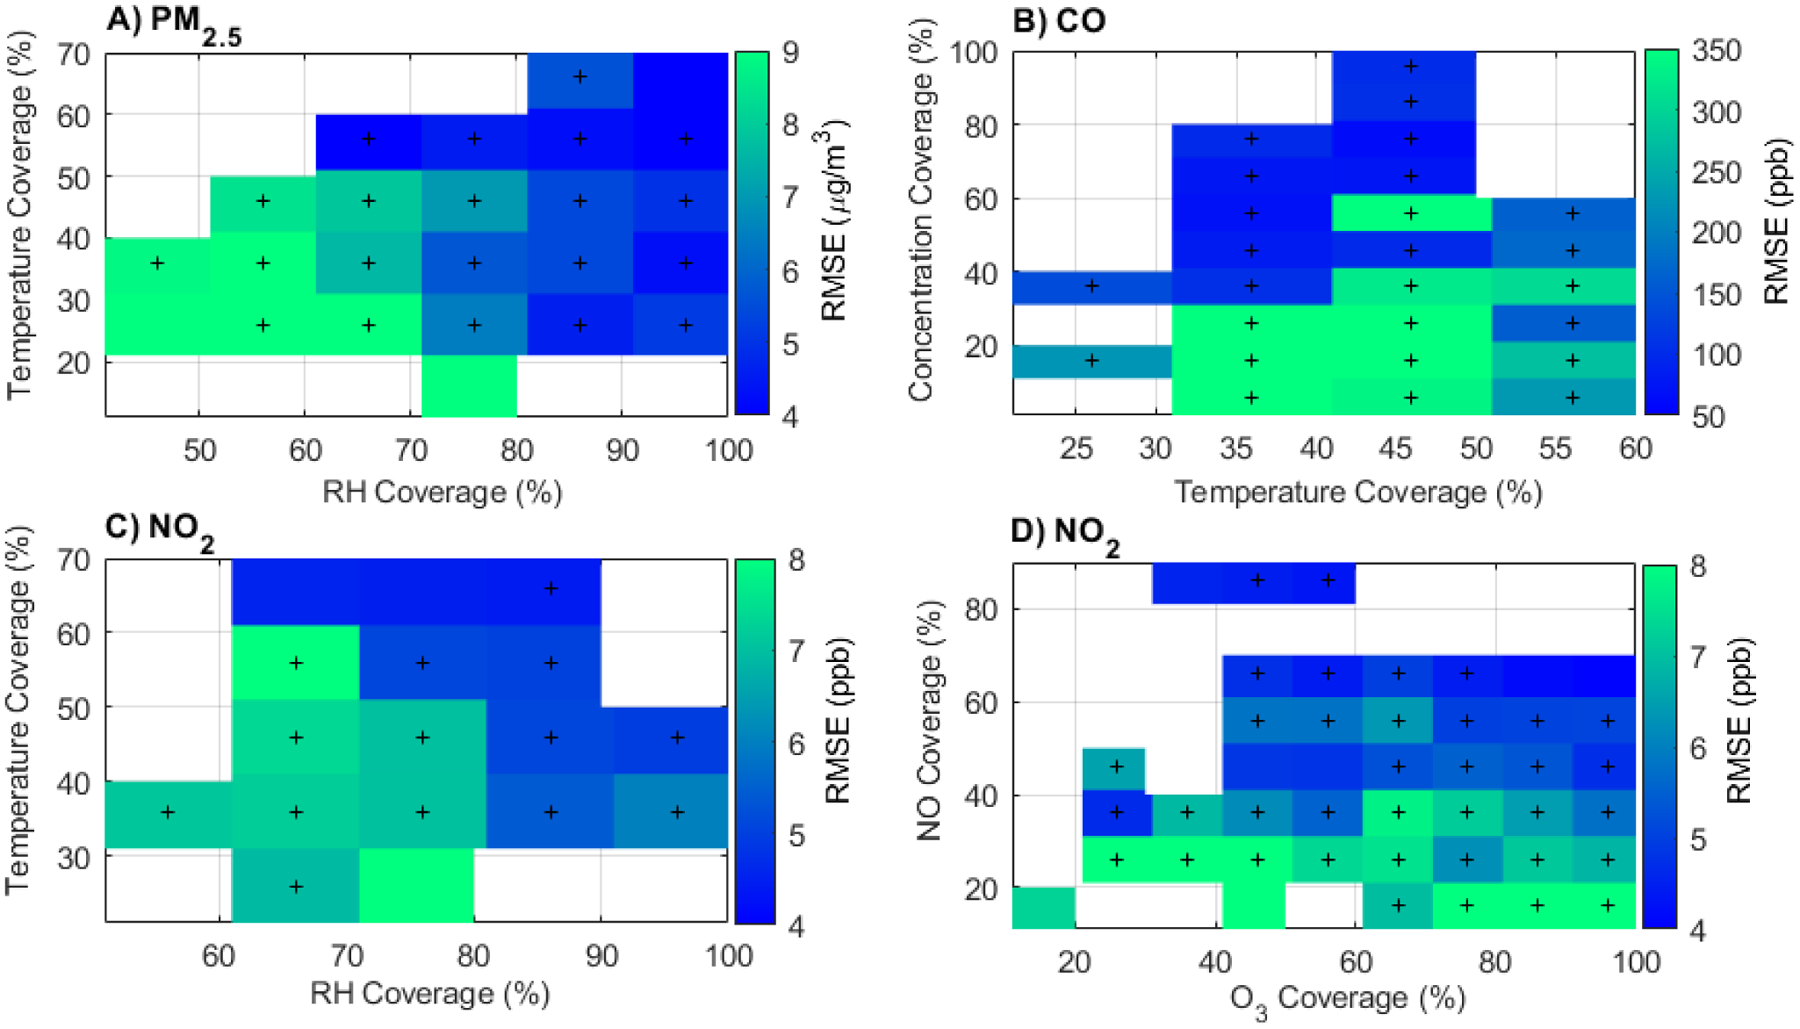
Figure 4.

Median RMSE values for PM2.5, CO, and NO2 sensors are shown as a function of data coverage (i.e., representation) of observed ambient conditions for key predictors within 1-week calibration periods. Bluer colors indicate better calibration results with lower RMSE. The + markers indicate where there were at least 25 calibration runs that fell within that box. The “coverage” values indicate the representativeness of the one-week calibration period compared to the full data set across all seasons. For example, if the temperature ranged from 0 to 40 °C over the full year and a given calibration period ranged from 0 to 12°C, the temperature coverage of that calibration period would be 30% (i.e., Δ12°C/40°C). The ambient temperature and RH ranged between −11 and 36 °C and 14 and 95% over the full year,
