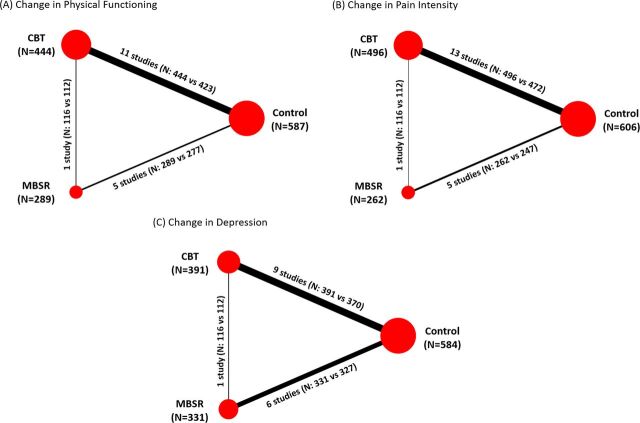
Figure 2.
Network diagrams by endpoint. Panels (A)–(C) present networks diagrams of the evidence analysed for the three endpoints. Treatment nodes for each network were sized to proportionately reflect the numbers of patients randomised to each intervention included in the network, while the thickness of the edges joining the treatment nodes was sized to proportionately reflect the number of studies informing each treatment comparison. Note: One study was a three-armed study comparing MBSR (n=116) and CBT (n=112) and control (n=113).34 CBT, cognitive behavioural therapy; MBSR, mindfulness-based stress reduction.

