Abstract
We examined trends in alcohol-associated liver disease (ALD)–related mortality in the United States from 1999 to 2022, focusing on sex, racial differences, and specific age groups. We analyzed age-adjusted mortality rates for ALD-related deaths using the CDC WONDER database and assessed differences between sex and racial groups. ALD-related mortality rates increased significantly between 1999 and 2022, with a more pronounced increase in females. White, Asian, Pacific Islander (AAPI), and American Indian or Alaska Native (AI/AN) groups showed significant uptrends in ALD-related mortality, while African Americans (AA) experienced a nonsignificant decline. Age-specific trends revealed substantial increases in crude mortality rates across various age groups, with the largest increase observed in the younger age groups of 25–34 years, with an average percent change of 11.12% from 2006 to 2022 (average annual percent change of 7.1% for the study period), and 35–44 years, which showed an average percent change of 17.2% from 2018 to 2022 (average annual percent change of 3.8% for the study period). This study reveals increased ALD-related mortality rates in the United States from 1999 to 2022, with disparities among sex, racial groups, and younger age groups. Continued monitoring and evidence-based interventions are needed to address the growing burden of ALD-related mortality, particularly in the younger population.

INTRODUCTION
Alcohol-associated liver disease (ALD) accounts for significant adult morbidity and mortality1,2. Recent studies suggest that females are more susceptible to alcohol-associated disorders than males3,4. With the changing national trends in the prevalence of liver pathologies, our study aims to examine trends in ALD-related mortality in the United States from 1999 to 2022.
METHODS
This study followed the STROBE reporting guideline and did not require informed consent or institutional review board approval as it utilized publicly available data that were deidentified, in compliance with the Common Rule.
We retrieved deidentified data from the Centers for Disease Control and Prevention Wide-Ranging Online Data for Epidemiologic Research (CDC WONDER) multiple causes of death database (years: 1999–2022)5,6. We considered individuals with ALD defined by the International Classification of Diseases-10 codes (K70.0-K70.9), as underlying cause of death.
We analyzed age-adjusted mortality rates (AAMRs) per 100,000 population, standardized to the 2000 United States population. We assessed temporal trends in the average percent change (APC) of mortality rates, fitted log-linear regression models to evaluate trends in AAMRs, and applied the simplest model with a maximum of 3 joinpoints and assuming a Poisson distribution. The final models estimated the APC, average annual percent change (AAPC), 95% CIs, and p-values, with statistical significance established at p ≤ 0.05. We conducted nonparallel pairwise comparisons to assess differences in trends between sex and racial groups, reporting AAPC differences. Racial groups included Whites, African Americans (AA), Hispanics, Asian or Pacific Islanders (AAPI), and American Indians or Alaska Natives (AI/AN). Statistical analyses were performed using the CDC WONDER database and the Joinpoint Regression Program. For comparison within age groups, we used crude mortality rates (CMRs) to report the aforementioned outcomes.
RESULTS
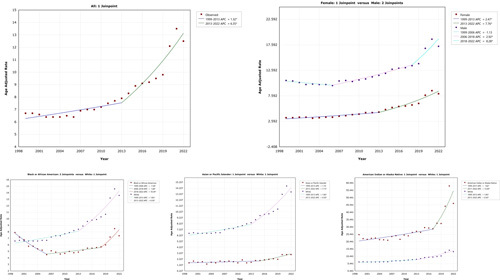
Between 1999 and 2022, 436,651 deaths were related to ALD. AAMR increased from 6.6/100,000 in 1999 to 13.5/100,000 in 2022, showing a significant AAPC of 3.3% (95% CI, 2.5%–4.0%, p < 0.001). (Figure 1 and Supplemental Table S1, http://links.lww.com/HC9/A330).
FIGURE 1.

Trends in alcohol-associated liver disease–related mortality from 1999 to 2022 in the United States, stratified by sex and race.
For females, AAMR increased from 3.3/100,000 in 1999 to 8/100,000 in 2022, with an AAPC of 4.5% (95% CI, 3.6%–5.4%, p < 0.001). For males, AAMR increased from 10.6/100,000 in 1999 to 17.3/100,000 in 2022, with an AAPC of 2.6% (95% CI, 1.6%-3.4%, p < 0.001). There was a significant 1.9% AAPC difference (95% CI, 0.5%–3.4%, p < 0.001), indicating a more pronounced mortality increase in females.
For the White race, AAMR increased from 6.6/100,000 in 1999 to 13.6/100,000 in 2022, showing a 3.6% AAPC (95% CI, 2.9%–4.4%, p < 0.001). For the AA race, AAMR decreased from 7.9/100,000 in 1999 to 7.4/100,000 in 2022, showing an AAPC of 0.3% (95% CI, −1.1% to 1.6%, p=0.674). There was a significant −3.4% AAPC difference (95% CI, −4.9% to −1.8%, p < 0.001), indicating lower ALD–related mortality trends in AA than White race. For AAPI, AAMR increased from 1.6/100,000 in 1999 to 3/100,000 in 2022 with a significant AAPC of 2.9% (95% CI, 1.6%–4.2%, p < 0.001). Comparing the cohort to Whites showed no significant AAPC difference (−0.7%, 95% CI, −2.2% to 0.7%, p=0.329), indicating similar mortality for the study period. For AI/AN, AAMR increased from 25.2/100,000 in 1999 to 46.5/100,000 in 2022, with an AAPC of 4.3% AAPC (95% CI, 2.8%–5.8%, p <0.001). Comparing AI/AN to the White race showed no significant AAPC difference (0.7%, 95% CI, −1.1% to 2.4%, p=0.456), indicating similar mortality trends for the study period.
For the age group 25–34 years, CMR increased from 0.6/100,000 in 1999 to 3.3/100,000 in 2022, with an AAPC of 7.1% (95% CI, 5.8–8.5, p < 0.001), particularly from 2006 to 2022 (APC 11.2%) (Supplemental Figure S1, http://links.lww.com/HC9/A331). For the age group 35–44 years, CMR increased from 4.8/100,000 in 1999 to 9.9/100,000 in 2022, with an AAPC of 3.8% (95% CI, 2.3–5.4, p < 0.001), particularly from 2018 to 2022 (APC 17.2%) (Supplemental Figure S1, http://links.lww.com/HC9/A331). For the age group 45–54 years, CMR increased from 10.4/100,000 in 1999 to 16.3/100,000 in 2022, with an AAPC of 2.2% (95% CI, 1.8–2.6, p < 0.001). For the age group 55–64 years, CMR increased from 12.0/100,000 in 1999 to 24.1/100,000 in 2022, with an AAPC of 3.3% (95% CI, 2.8–3.8, p < 0.001). For the age group 65–74 years, CMR increased from 10.5/100,000 in 1999 to 17.8/100,000 in 2022, with an AAPC of 2.6% (95% CI, 2.2–3.0, p < 0.001). For the age group 75–84 years, CMR increased from 6.5/100,000 in 1999 to 10.4/100,000 in 2022, with an AAPC of 2.4% (95% CI, 1.5–3.2, p < 0.001).
For the age group 85+ years, CMR increased from 2.8/100,000 in 1999 to 4.5/100,000 in 2022, with an AAPC of 2.7% (95% CI, 1.5–2.9, p < 0.001) (Supplemental Table S2, http://links.lww.com/HC9/A330).
DISCUSSION
Our study examined trends in ALD-related mortality from 1999 to 2022, revealing a significant increase in mortality rates, with a more pronounced rise among females. The White, AAPI, and AI/AN showed a significant uptrend in ALD-related mortality; however, AA had a nonsignificant decline for the study period. Age-specific analysis indicated substantial increases in CMRs across various age groups, particularly in the younger age groups of 25–34 years, which showed an APC of 11.12% from 2006 to 2022 (AAPC of 7.1% for the study period), and 35–44 years, which showed an APC of 17.2% from 2018 to 2022 (AAPC of 3.8% for the study period), as shown in Supplemental Figure S1, http://links.lww.com/HC9/A331.
We emphasize the importance of addressing the highest rate of change observed in these younger age groups. The higher rates of ALD-related mortality highlight a critical concern that requires immediate attention from researchers, policymakers, and health care professionals. This alarming trend underscores the need for targeted public health interventions for younger populations.
Our study is limited by potential misclassification bias in death certificate data. It highlights the need for ongoing efforts to address the growing burden of ALD-related mortality, considering the disparities among sex, racial groups, and younger age groups. Continued monitoring and development of evidence-based interventions can improve public health outcomes.
Supplementary Material
AUTHOR CONTRIBUTIONS
Concept and design: Fariha Ilyas and Hassam Ali. Acquisition, analysis, or interpretation of data: Fariha Ilyas and Debargah Basuli. Drafting of the manuscript: Fariha Ilyas and Alexa Giammarino. Critical revision of the manuscript for important intellectual content: Hassam Ali, Pratik Patel, and Sanjaya K. Satapathy. Statistical analysis: Hassam Ali and Debargah Basuli. Administrative, technical, or material support: Pratik Patel. Supervision: Pratik Patel and Sanjaya Kumar Satapathy. Fariha Ilyas and Hassam Ali had full access to all of the data in the study and took responsibility for the integrity of the data and the accuracy of the data analysis.
CONFLICTS OF INTEREST
The authors have no conflicts to report.
Footnotes
Abbreviations: AA, African Americans; AAMRs, Age-Adjusted Mortality Rates; AAPC, Average Annual Percent Change; AAPI, Asian or Pacific Islanders; AI/AN, American Indian or Alaska Natives; ALD, Alcoholic Liver Disease; APC, Average Percent Change; CDC, Centers for Disease Control and Prevention; CI, Confidence Intervals; CMR, Crude Mortality Rates; WONDER, Wide-Ranging Online Data for Epidemiologic Research
Supplemental Digital Content is available for this article. Direct URL citations are provided in the HTML and PDF versions of this article on the journal's website, www.hepcommjournal.com.
Contributor Information
Fariha Ilyas, Email: ilyas.fariha@gmail.com.
Hassam Ali, Email: hassamali155@gmail.com.
Pratik Patel, Email: ppatel73@northwell.edu.
Debargha Basuli, Email: dbasuli@gmail.com.
Alexa Giammarino, Email: amgiammarino@gmail.com.
Sanjaya K. Satapathy, Email: ssatapat@northwell.edu.
REFERENCES
- 1.Ransome Y, Carty DC, Cogburn CD, Williams DR. Racial disparities in the association between alcohol use disorders and health in black and white women. Biodemography Soc Biol. 2017;63:236–52. [DOI] [PMC free article] [PubMed] [Google Scholar]
- 2.White A, Castle IJP, Chen CM, Shirley M, Roach D, Hingson R. Converging patterns of alcohol use and related outcomes among females and males in the united states, 2002 to 2012. Alcohol Clin Exp Res. 2015;39:1712–26. [DOI] [PubMed] [Google Scholar]
- 3.White AM. Gender differences in the epidemiology of alcohol use and related harms in the united states. Alcohol Res. 2022;40:01. [DOI] [PMC free article] [PubMed] [Google Scholar]
- 4.Alvanzo A, Storr CL, Mojtabai R, Green KM, Pacek LR, La Flair LN, et al. Gender and race/ethnicity differences for initiation of alcohol-related service use among persons with alcohol dependence. Drug Alcohol Depend. 2014;140:48–55. [DOI] [PMC free article] [PubMed] [Google Scholar]
- 5.Centers for Disease Control and Prevention. CDC WONDER (Wide-Ranging Online Data for Epidemiologic Research) Database. 2021. Accessed February 15, 2022. https://wonder.cdc.gov/
- 6.Murphy SL, Xu J, Kochanek KD, Arias E, Tejada-Vera B. Deaths: final data for 2018. Natl Vital Stat Rep. 2021;69:1–83. [PubMed] [Google Scholar]


