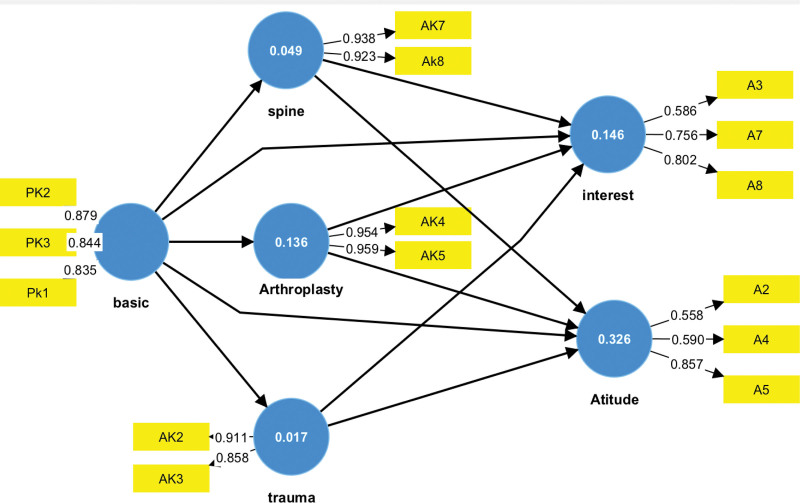
Figure 1.
Figure 1 shows the measurement model and factor loadings for each questionnaire construct. Yellow rectangular shapes represent questions (factors), while blue circular shapes represent constructs (latent variables). Large arrows between circles represent the relationship between latent variables, while small arrows between rectangles and circles represent factor loadings in latent variables (Using smartPLS® v.4.).

