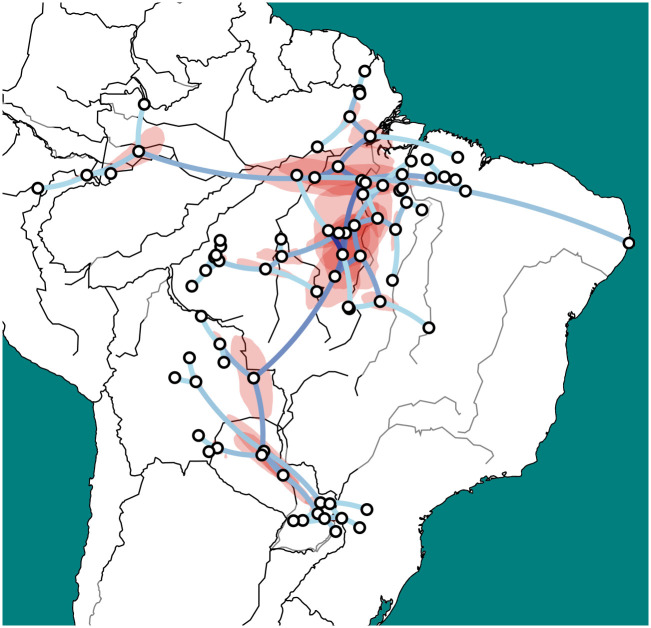
Fig 4. Output of the phylogeographical model.
Brightness of edge colors (blue shades) indicates the mean common ancestor height, with darker colors indicating older inferred movements. Geographic areas in red indicate the 80% confidence for location of intermediate nodes. An interactive visualization is available online at https://tupiguarani.netlify.app/ and in the supplementary material. Prepared by the authors with SpreaD3 version 0.9.6 [109], based on public domain data and raster images from “Natural Earth” for political boundaries and hydrography.

