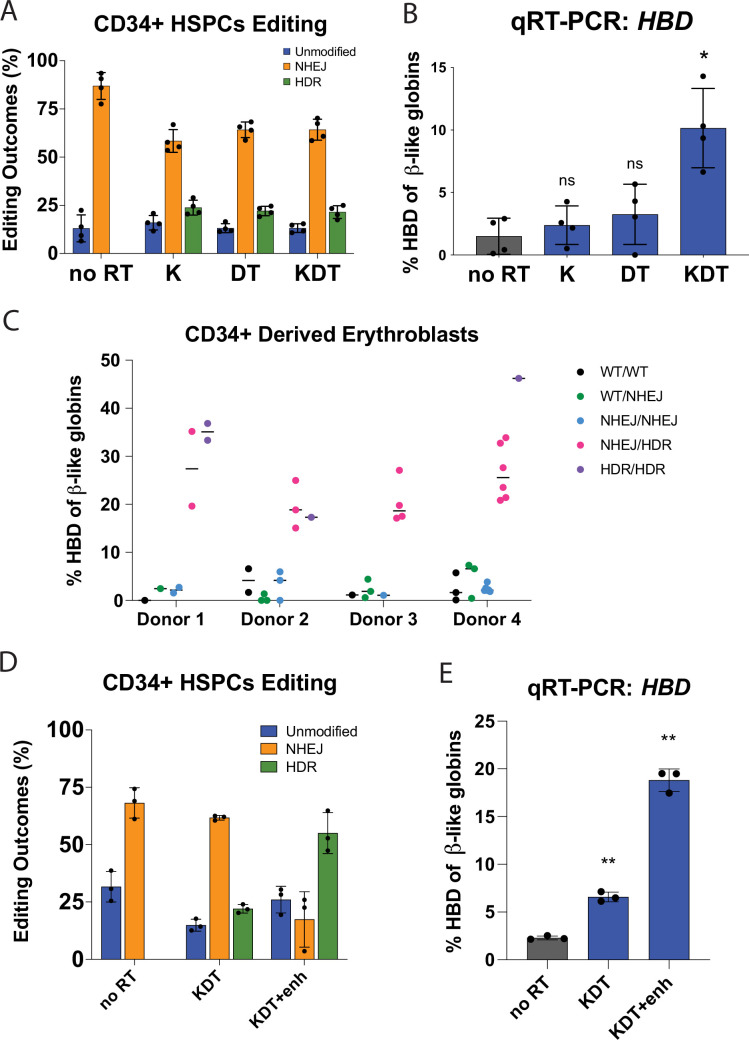
Figure 3. Endogenous editing of the HBD promoter in HSPCs.
(A) Editing efficiencies showing percentages of unmodified, NHEJ, or HDR alleles. Conditions tested were Cas9 and sgRNA RNP with no repair template (no RT), K, DT, and KDT repair templates. The data is presented as independent editing experiments with four different donor samples. (B) qRT-PCR of HBD after pooled editing of HSPCs with no RT, K, DT, and KDT. Cells were expanded in erythroid expansion conditions and differentiated for 5 days. Data is plotted as % of all β-like globins (HBB, HBG1/2, HBD). The data is presented as independent editing experiments with four different donor samples. (C) qRT-PCR of HBD of clonal erythroblast populations after 5 days of differentiation. Genotypes were determined by NGS. Data is plotted as % of β-like globins (HBB, HBG1/2, HBD). The data is presented as independent editing experiments with four different donor samples and each dot denotes an individual clonal population. (D) Editing efficiencies showing percentages of unmodified, NHEJ, or HDR alleles. Conditions tested were Cas9 and sgRNA RNP with no repair template (no RT), KDT repair template, and KDT repair template with AZD-7648 (KDT +enh). The data is presented as one editing experiment with three different donor samples. (E) qRT-PCR of HBD after pooled editing of HSPCs with no RT, KDT, or KDT +enh. Cells were expanded in erythroid expansion conditions and differentiated for 5 days. Data is plotted as % of all β-like globins (HBB, HBG1/2, HBD). The data is presented as one editing experiment with three different donor samples.


