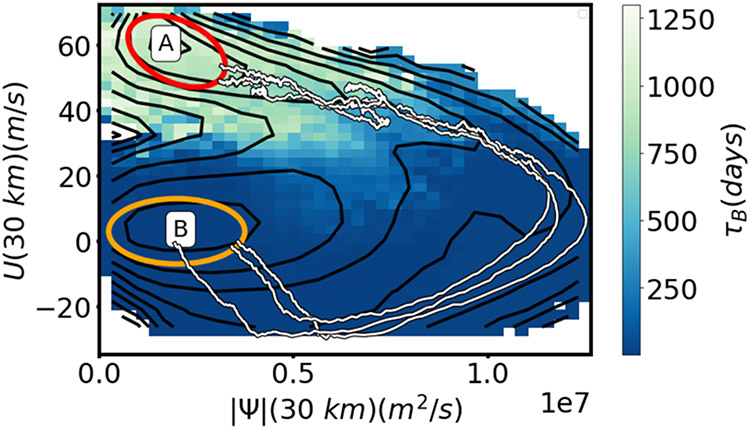
Figure 7:
Illustration of some key properties of the Holton Mass model relevant to the prediction problems considered here. Red and yellow ellipses approximately mark the projections of states and , respectively, on the collective variables. The background color shows the average time to hit state , clipped to a maximum of 1300 days to show detail. Black contours show the negative logarithm of the stationary density marginalized on these collective variables. Three transition paths harvested from a long simulation are shown in white.

