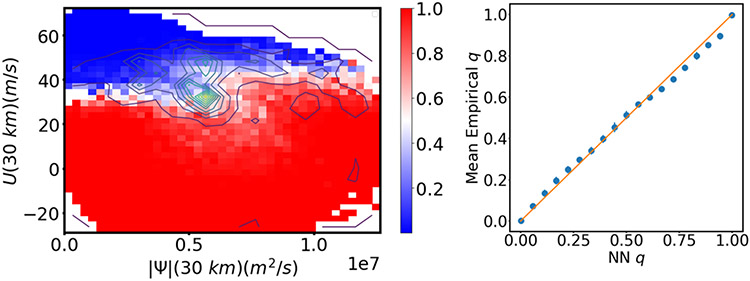
Figure 9:
Committor for the Holton-Mass model. (left) Colors show predictions, and contour lines show the density of added points from the adaptive sampling scheme described in Section 5. (right) Comparison of predicted and reference committors. Symbols show (30). Error bars show the standard deviation from networks trained on ten separate data sets resulting from the adaptive sampling scheme.

