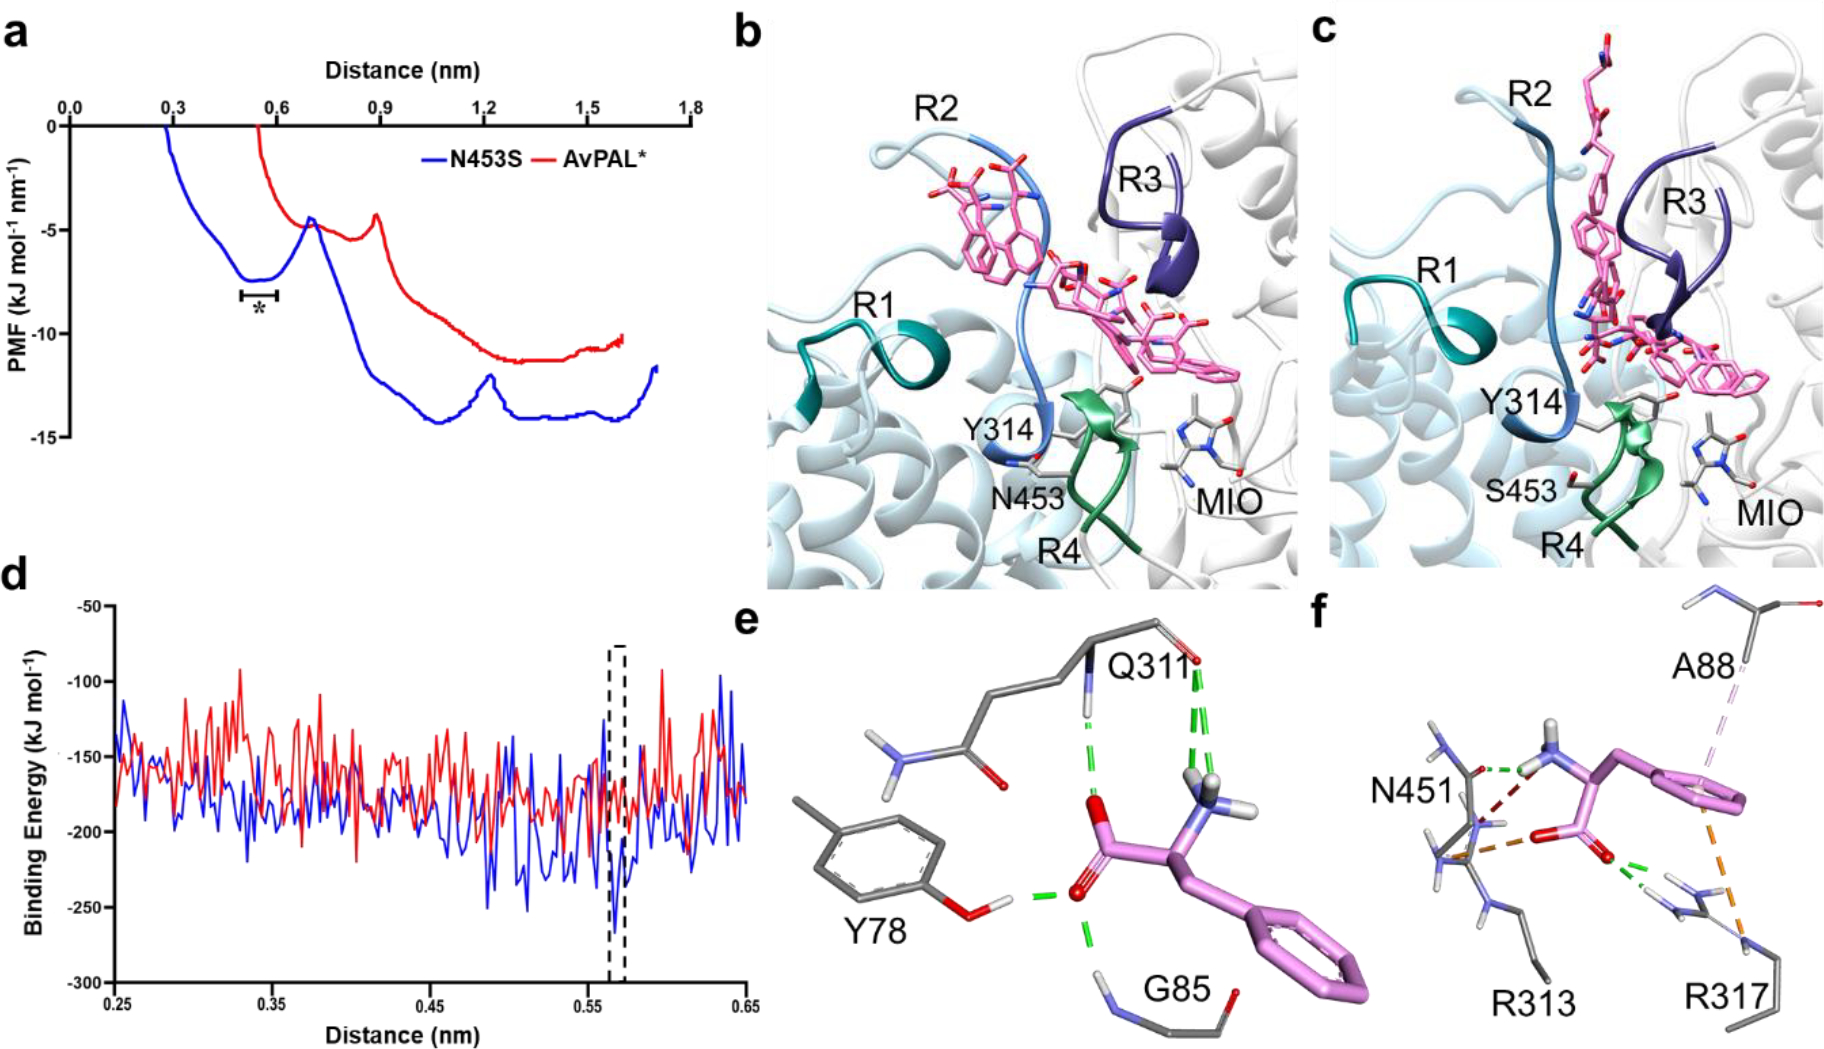
Figure 6. Results from SMD and umbrella sampling for parental AvPAL* and N453S.

a) The conformational transition of the substrate along the PMF profile, b) extracted from the parental and c) mutant N453S. The peripheral regions of the substrate entry path are highlighted as R1, R2, R3, and R4. They composed of residues 397–403, 308–315 of chain C and 83–94, 446–455 of chain A, respectively. The region marked in as (*) in (a) is the free energy dip that facilities the substrate entry in N453S. d) Binding free energy calculations showed higher affinity of Phe for mutant N453S. e, f) E-S complex extracted from free energy calculations with least binding energies for parental and mutant (dotted box in (d)) reveal that the substrate is stabilized by salt bridges and hydrogen bonds in N453S and only hydrogen bonds in the parent. Green lines show hydrogen bond interactions, orange lines are salt bridge interactions, and light pink lines are hydrophobic interactions.
