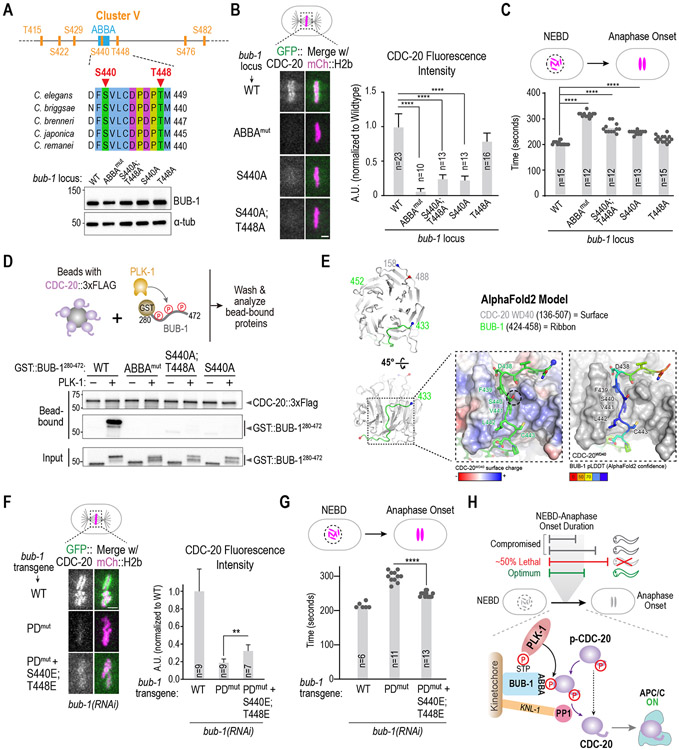
Figure 4. Mechanism by which PLK-1 phosphorylation promotes CDC-20 kinetochore recruitment.
(A) (top) Details on sites mutated in Cluster V, which is centered around the ABBA motif. (bottom) Immunoblot of BUB-1 following genome-editing of the endogenous bub-1 locus to introduce the indicated mutations. The genome editing was conducted in a strain with transgene-encoded GFP::CDC-20 and mCherry::H2b. (B) Analysis of CDC-20 localization in the indicated conditions. n is the number of embryos quantified. Scale bar, 2 μm. (C) Quantification of NEBD-anaphase onset interval for the indicated conditions. n is the number of embryos quantified. Error bars are the 95% confidence interval. (D) (top) Schematic of assay used to assess interaction of an ABBA motif-containing BUB-1 fragment with full-length CDC-20; constitutively-active purified PLK-1 was used to phosphorylate the BUB-1 fragment. (bottom) Results of binding assay conducted with wildtype or indicated specific mutant GST::BUB-1 fragments. Top two immunoblots show proteins bound to CDC-20-coated beads; bottom immunoblot is of the input GST::BUB-1 fragments phosphorylated by PLK-1. Results shown are representative of two independent experiments. (E) AlphaFold2 model of C. elegans BUB-1 ABBA motif and C. elegans CDC-20. Two views show the overall position of the BUB-1 ABBA motif (green) docked against the WD40 beta-propeller domain (grey) in CDC-20. The start and ends of the shown chains are represented with blue and red colored spheres, respectively. The enlarged, space-filled zoom views show: overall surface charge on ABBA binding site on CDC-20 WD40 (left); confidence score of BUB-1 ABBA motif residues in this binding site (right). The Ser440 residue is outlined by a black dotted circle. (F) Analysis of CDC-20 localization in the indicated conditions, with quantification on the right. n is the number of embryos quantified. Scale bar, 2 μm. (G) Quantification of NEBD-anaphase onset interval for the indicated conditions. n is the number of embryos quantified. Error bars are the 95% confidence interval. (H) Model summarizing key findings of the study. All p-values are from unpaired t-tests; **:p<0.01; ****: p<0.0001. See Figure S4 for supporting information.

