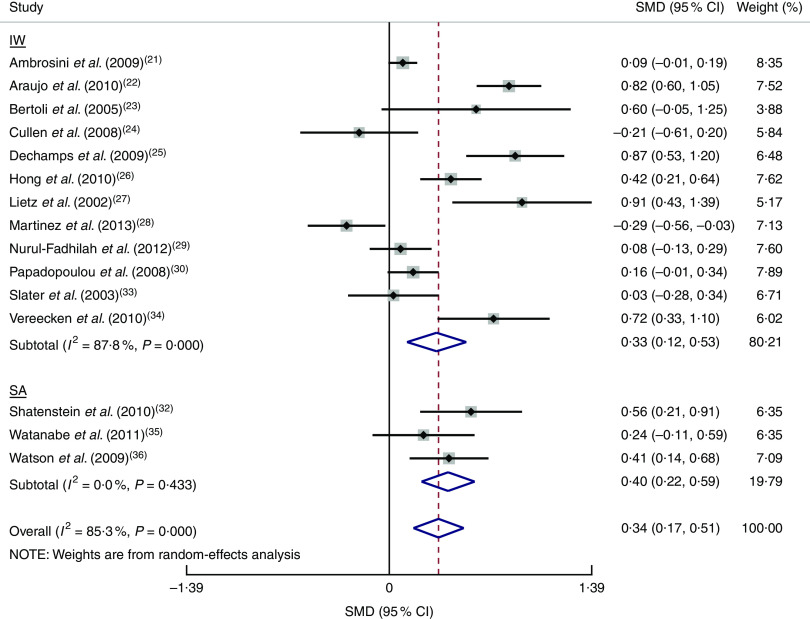
Fig. 2.
Forest plot of standardized mean differences (SMD) of the energy intake in adolescents estimated by FFQ compared with a reference dietary instrument of food records or 24 h recalls, by administration mode (IW, interviewer-administered; SA, self-administered). The study-specific SMD and 95 % CI are represented by the black diamond and horizontal line, respectively; the area of the grey square is proportional to the specific-study weight to the overall meta-analysis. The centre of the open diamond presents the pooled SMD and its width represents the pooled 95 % CI

