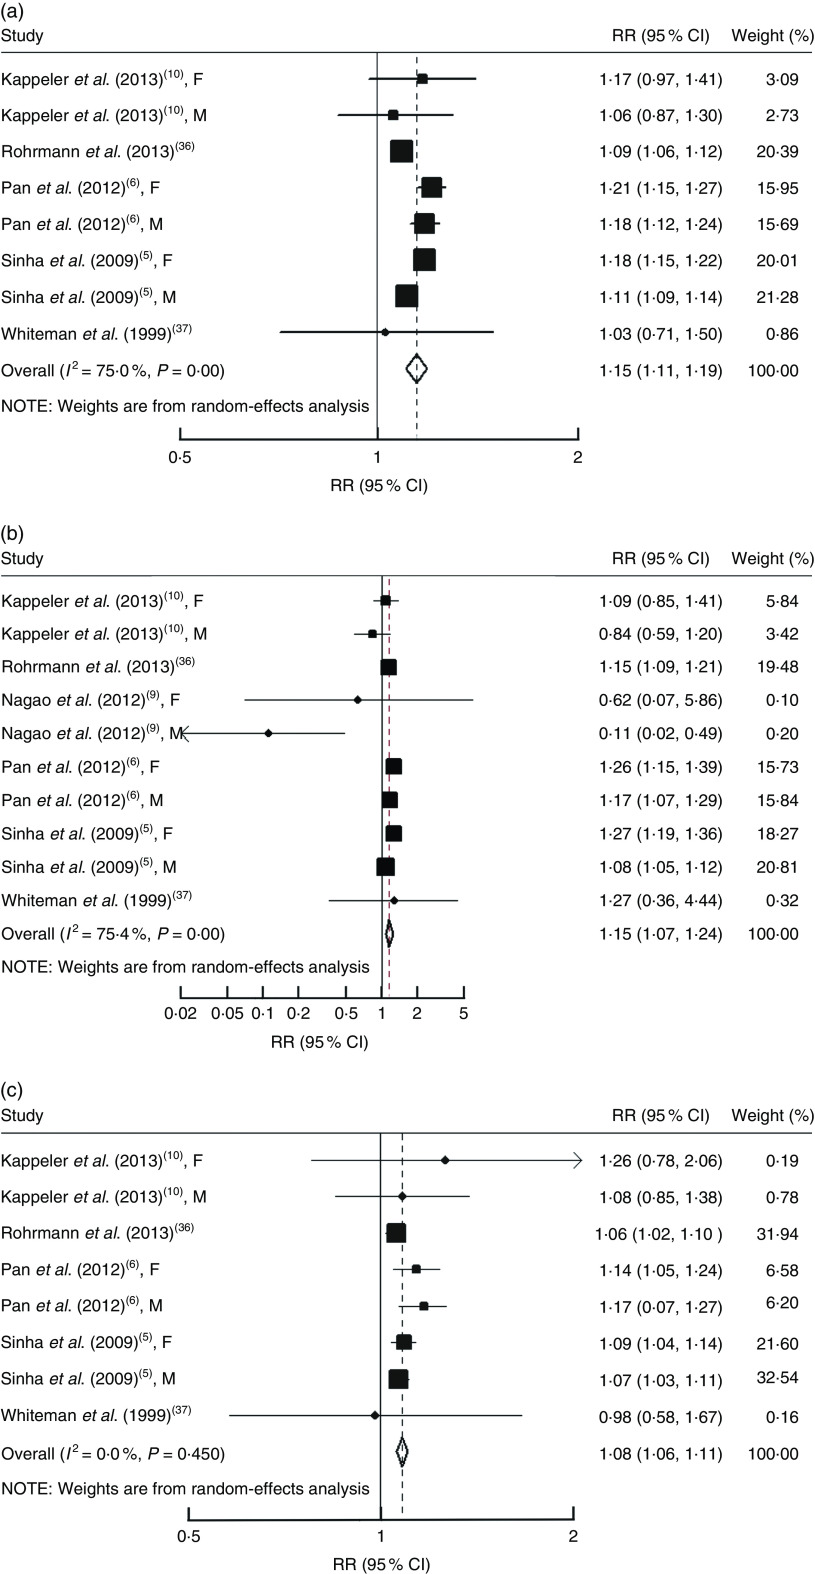
Fig. 1.
Risk of (a) all-cause mortality, (b) cardiovascular mortality and (c) cancer mortality associated with each serving per day of processed meat. The study-specific relative risk (RR) and 95 % CI are represented by the black square and horizontal line, respectively; the area of the black square is proportional to the specific-study weight to the overall meta-analysis. The centre of the open diamond presents the pooled RR and its width represents the pooled 95 % CI. Weights are from random-effects analysis (F, female; M, male)

