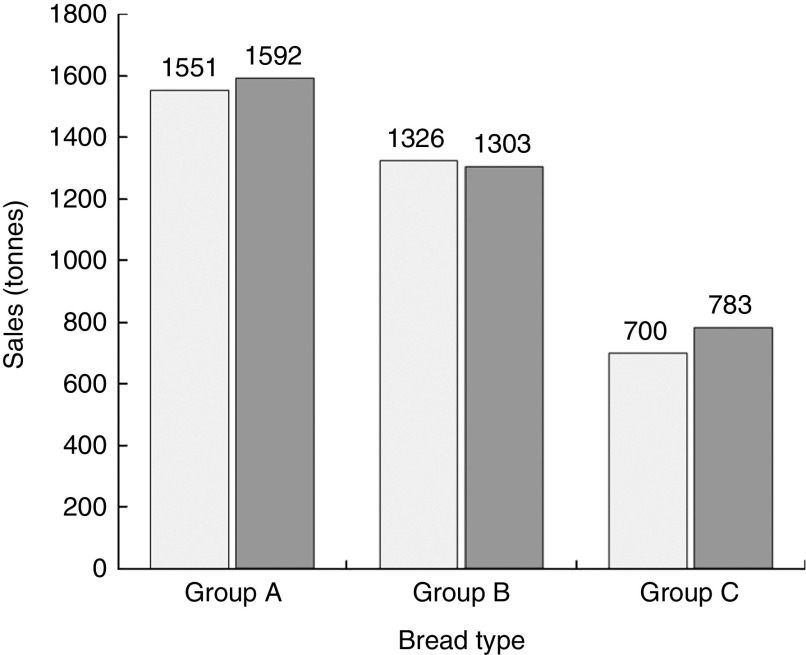
Fig. 1.
Sales of reduced-salt bread in 2013 ( ) compared with sales of the same breads with standard salt content in 2012 (
 ), according to type (group A, breads containing bran; group B, various breads containing seeds and/or other cereals; group C, breads containing rye and seeds), in a feasibility and acceptability study of salt reduction in partially baked breads, Spain

