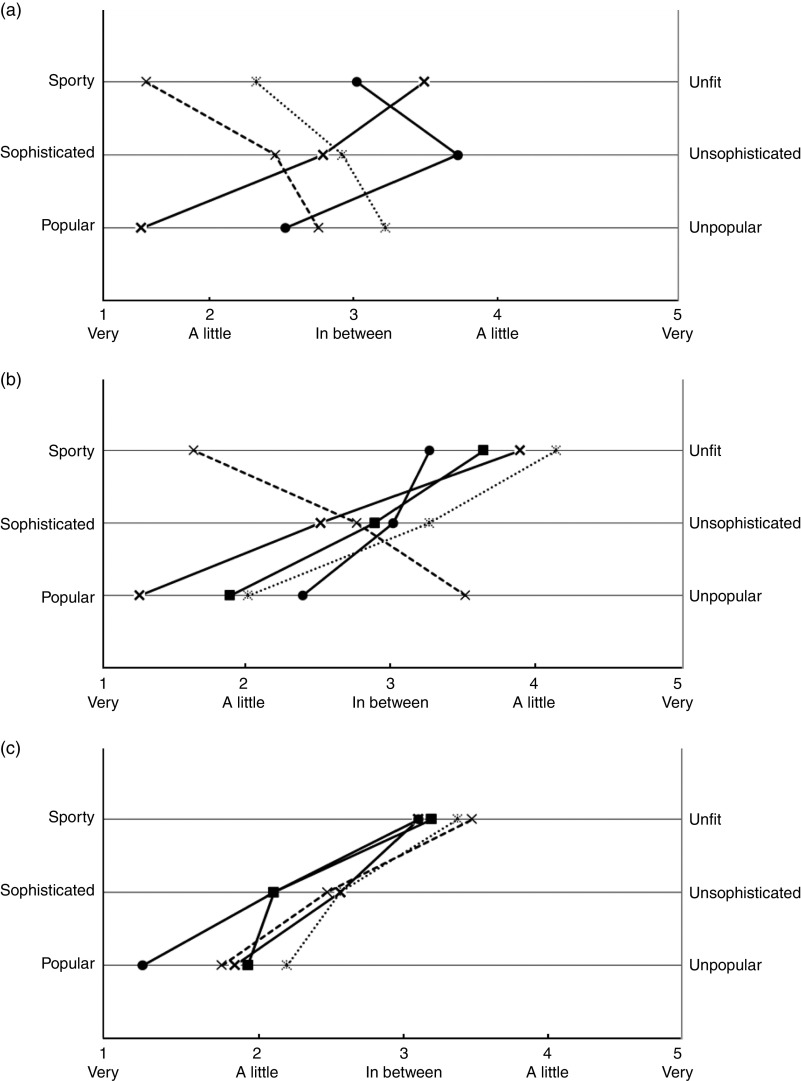
Fig. 1.
Mean ratings on semantic differential scales (with 1 indicating strong positive perceptions and 5 indicating strong negative perceptions) for (a) users of beverage brands ( , mean Coca-Cola;
  , mean Mount Franklin;
  , mean Goulburn Valley;
  , mean Red Bull), (b) users of fast-food brands (
 , mean McDonald’s;
  , mean Sumo Salad;
  , mean KFC;
  , mean Red Rooster;
  , mean Dominos) and (c) users of snack brands (
 , mean Mars;
  , mean Freddo Frog;
  , mean Pringles;
  , mean Cadbury;
  , mean Red Rock Deli) in an online survey by children aged 10–16 years (n 417), New South Wales, Australia, October–November 2014

