
Fig. 2.
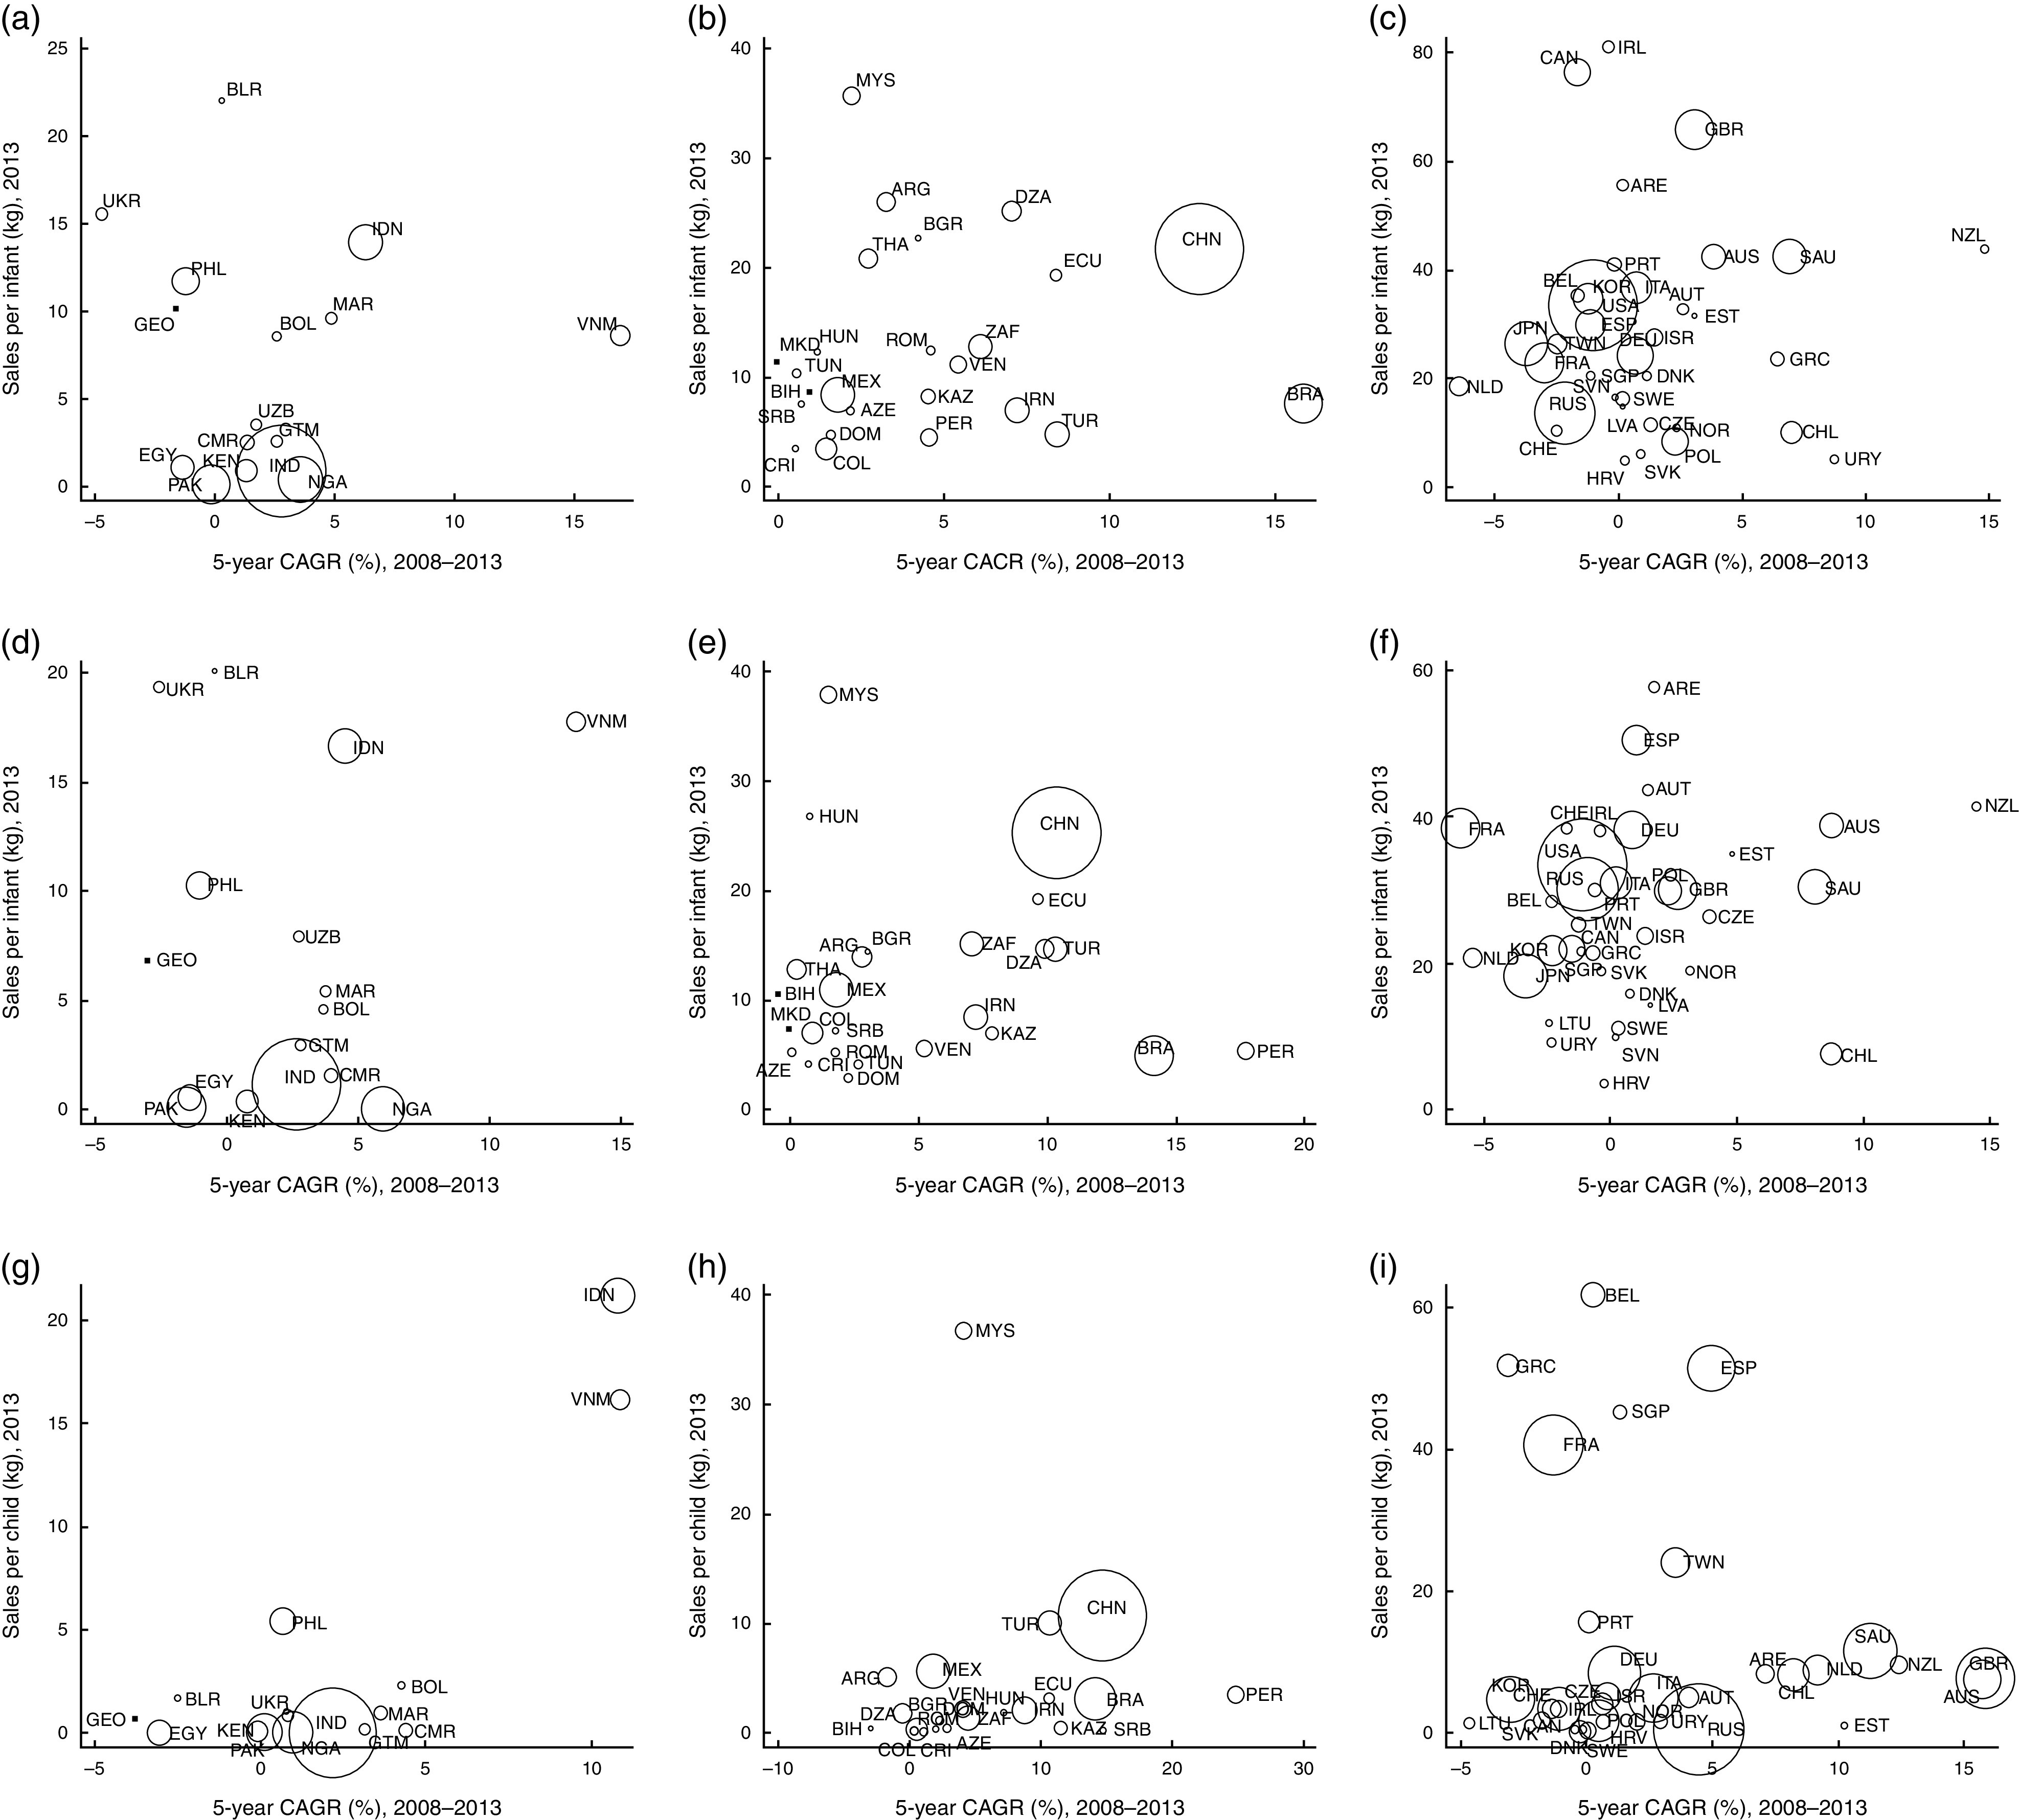
Formula sales volumes (kg) per infant/child in 2013 v. 5-year compound annual growth rates (CAGR; %) for 2008–2013, for countries grouped by income category, with weighted markers representing infant/child population sizes: (a) infant formula, L-MIC; (b) infant formula, U-MIC; (c) infant formula, H-IC; (d) follow-up formula, L-MIC; (e) follow-up formula, U-MIC; (f) follow-up formula, H-IC; (g) toddler formula, L-MIC; (h) toddler formula, U-MIC; (i) toddler formula, H-IC. See Table 1 for country abbreviations; data from Euromonitor Passport Global Market Information database( 32 ); population estimates are for infants/children aged 0–6 months for infant formula, 7–12 months for follow-up formula and 13–36 months for toddler formula. Fig. 1(c) excludes JPN and outliers not shown are HKG (269·3 kg, 14·3 %) and FIN (114·8 kg, –0·8 %); Fig. 1(f) outliers not shown are HKG (100·5 kg, 4·9 %) and FIN (72·3 kg, –0·6 %); Fig. 1(g) excludes UZB; Fig. 1(e) excludes MKD and outlier not shown is THA (68·8 kg, 6·3 %); Fig. 1(i) excludes JPN and USA and outliers not shown are HKG (298·7 kg, 10·7 %) and FIN (1·3 kg, 33·0 %). L-MIC, lower–middle income countries; U-MIC, upper–middle income countries; H-IC, high-income countries