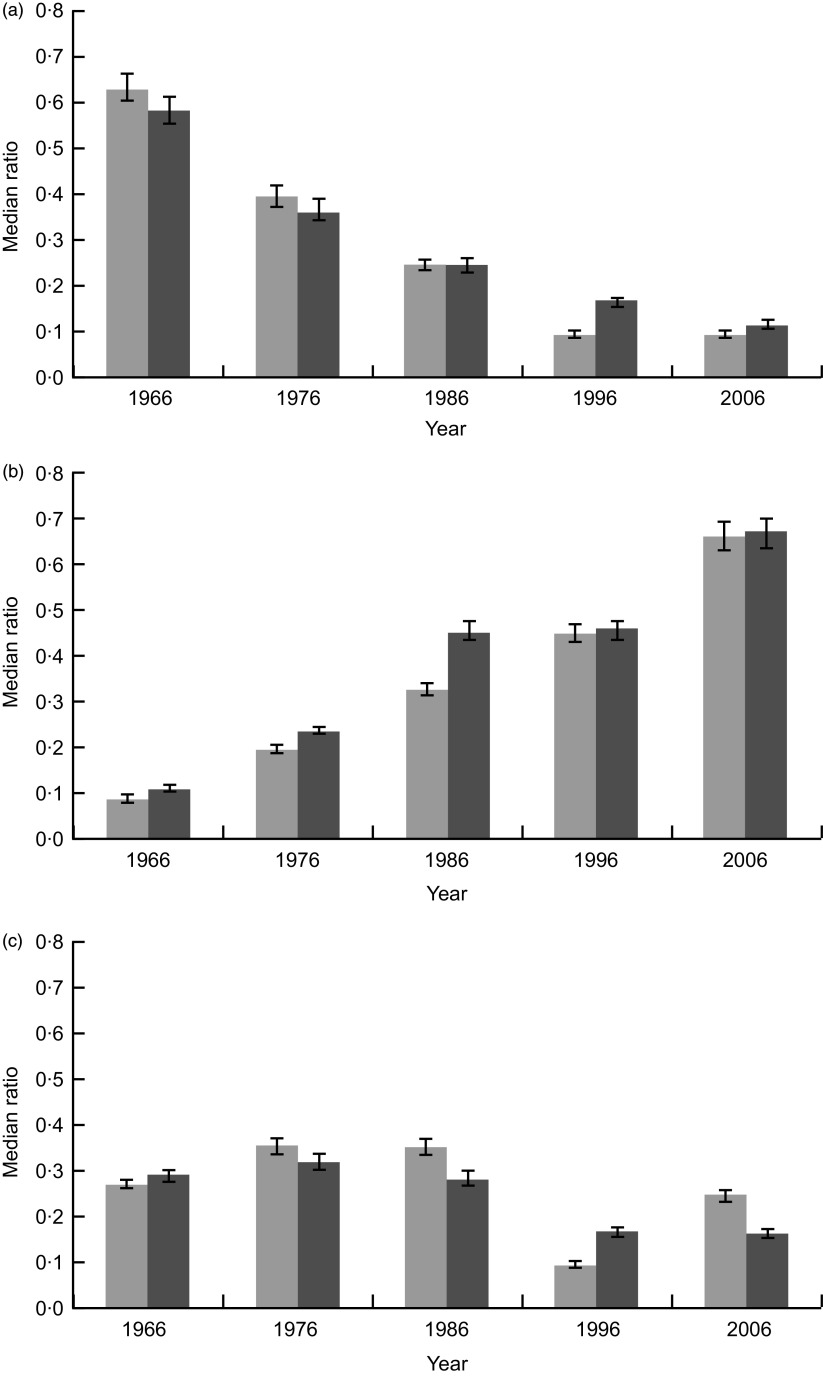
Fig. 1.
Ratio of the number of (a) supermarkets/grocery stores, (b) fast-food outlets and (c) convenience/fruit and vegetable stores to total food outlets within 800 m of schools ( , primary schools;
  , secondary schools), Christchurch, New Zealand, 1966–2006. Values are medians, with their 95 % confidence intervals represented by vertical bars

