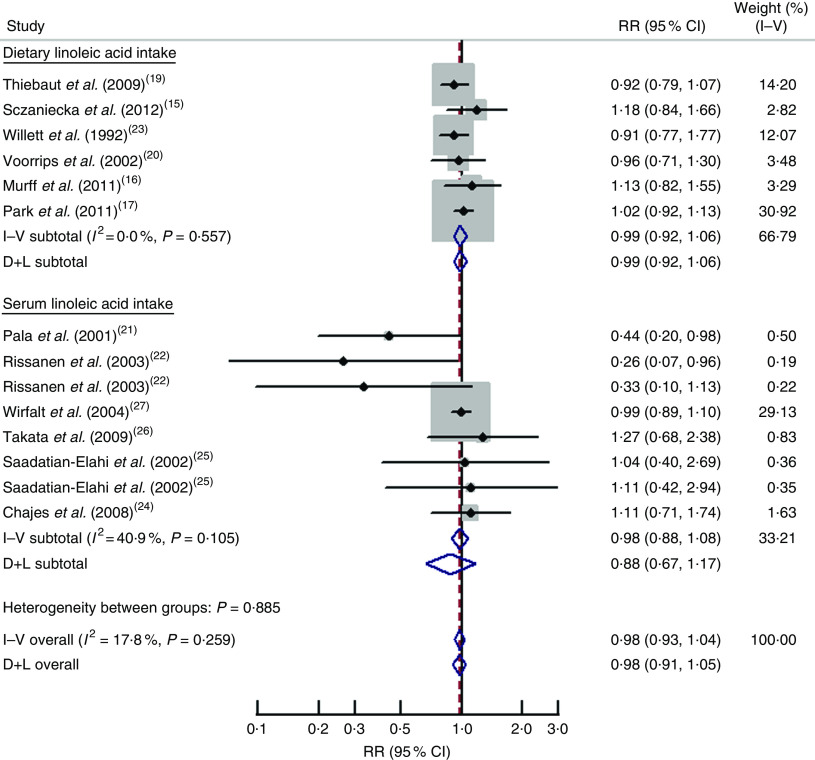
Fig. 2.
Forest plot for the pooled relative risk (RR) from prospective studies of linoleic acid and breast cancer risk. The study-specific RR and 95 % CI are represented by the black dot and horizontal line, respectively; the area of the grey square is proportional to the specific-study weight to the overall meta-analysis. The centre of the open diamond presents the pooled RR and its width represents the pooled 95 % CI. D+L denotes the random-effect model; I–V denotes the fixed-effect model

