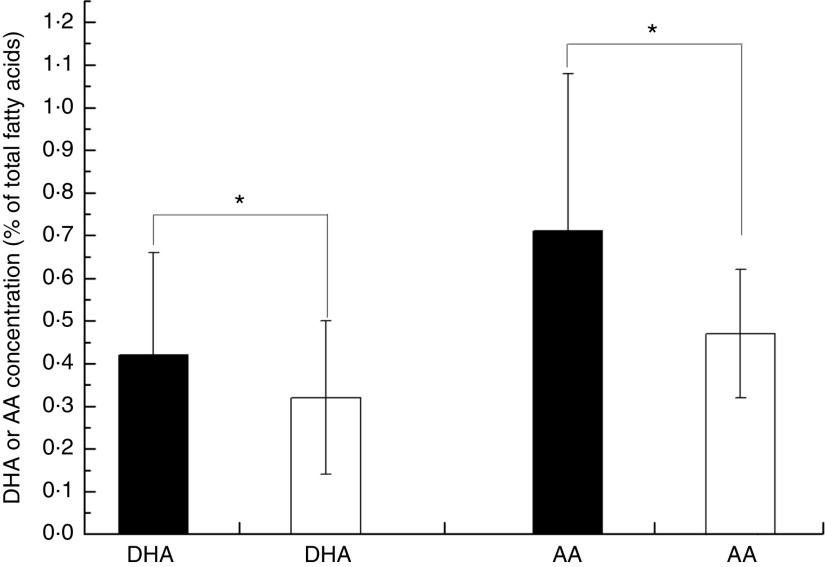
Fig. 6.
Worldwide levels of breast-milk DHA and arachidonic acid (AA) reported before ( ) and after 2007 (
 ). Values are means with their standard deviation represented by vertical bars (seventy-eight studies from forty-one countries were included with 4163 breast-milk samples of 3746 individuals). Mean values were significantly different before and after 2007: *P<0·05

