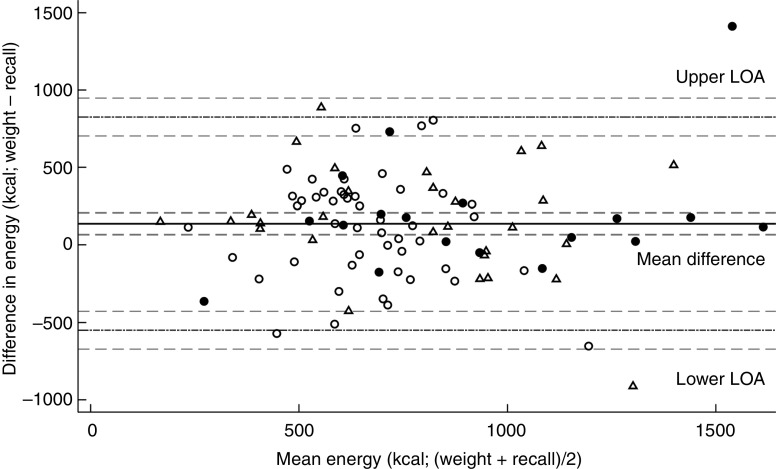
Fig. 3.
Bland–Altman plots assessing the validity of a photographic food atlas of common foods for assessing energy intake among a random sample of ninety-five adults ( , pregnant woman; ●, household head;
  , mother-in-law) in forty-eight rural households with a pregnant woman in southern Nepal, March–June 2014. The difference in energy intake (in kilocalories; 1 kcal=4·184 kJ) between the weighed method and the recall method is plotted v. the mean energy intake from the two methods. ——— represents the mean difference; — · — · — represent the upper and lower limits of agreement (LOA) and – – – – – represent the 95 % confidence interval of the mean difference/LOA. Upper LOA=3456 (95 % CI 2944, 3967) kJ (825·9 (703·6, 948·2) kcal); mean difference =576 (95 % CI 280, 871) kJ (137·6 (95 % CI 67·0, 208·2) kcal); lower LOA=–2304 (95 % CI –2815, –1792) kJ (–550·6 (95 % CI –672·9, –428·3) kcal)

