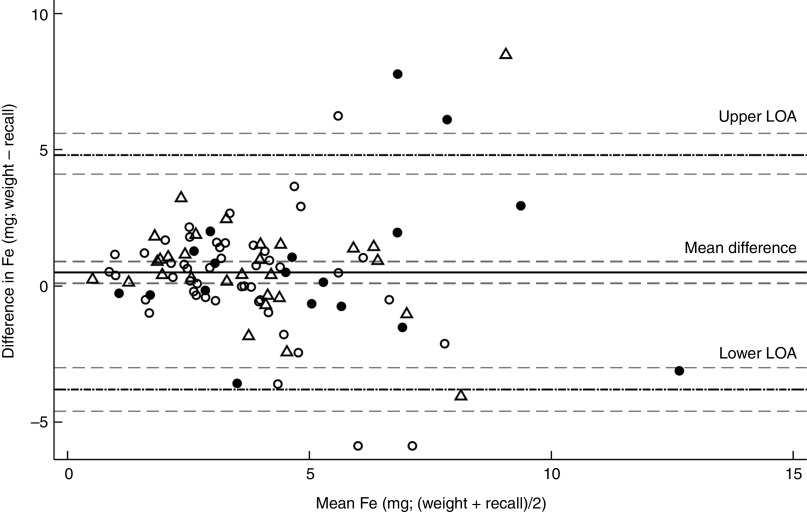
Fig. 5.
Bland–Altman plots assessing the validity of a photographic food atlas of common foods for assessing iron intake among a random sample of ninety-five adults ( , pregnant woman; ●, household head;
  , mother-in-law) in forty-eight rural households with a pregnant woman in southern Nepal, March–June 2014. The difference in iron intake (in milligrams) between the weighed method and the recall method is plotted v. the mean iron intake from the two methods. ——— represents the mean difference; — · — · — represent the upper and lower limits of agreement (LOA) and – – – – – represent the 95 % confidence interval of the mean difference/LOA. Upper LOA=4·8 (95 % CI 4·1, 5·6) mg; mean difference = 0·5 (95 % CI 0·1, 0·9) mg; lower LOA = –3·8 (95 % CI –4·6, –3·0) mg

