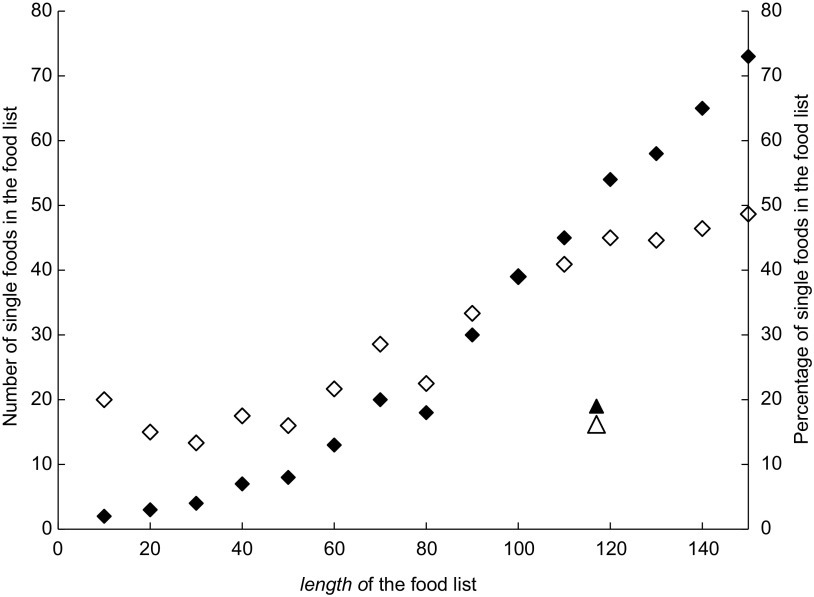
Fig. 3.
Impact of the length of the food list on the absolute and relative number of single foods selected for the food list; ⧫ represents the number of single foods in MILP food lists, ◊ the percentage of single foods in MILP food lists, ▴ the number of single foods in the ValNed food list and ▵ represents the percentage of single foods in the ValNed food list. For example, the MILP-generated food list of length twenty items contained three single foods (15 %) and seventeen aggregated food items. The ValNed food list of length 117 items contained nineteen single foods (16 %) and ninety-eight aggregated food items (MILP, Mixed Integer Linear Programming)

