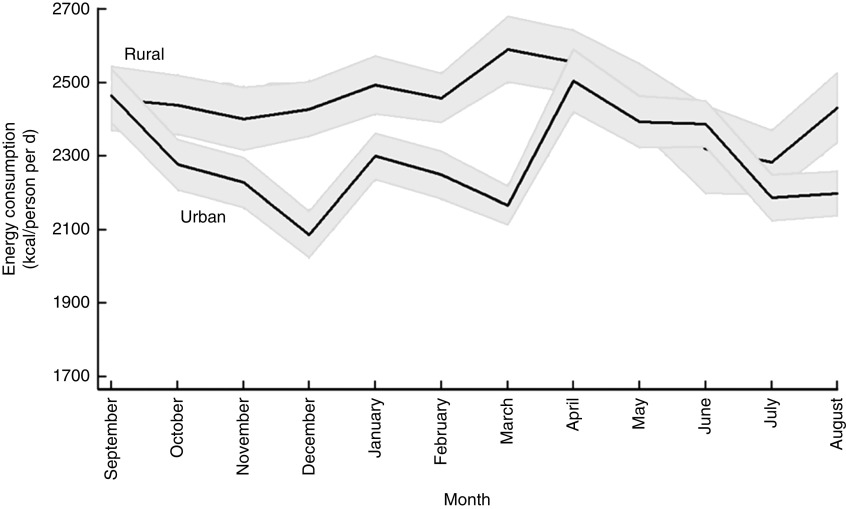
Fig. 1.
Seasonal patterns in mean daily per capita energy intake, by rural/urban setting, among 27 835 households from eleven regions of Ethiopia; Household Consumption and Expenditure Survey, 2010/11( 35 ). The vertical axis measures daily per capita energy consumption of households in kilocalories (1 kcal=4·184 kJ). The solid line gives the mean for each calendar month and the grey area represents the 95 % confidence interval

