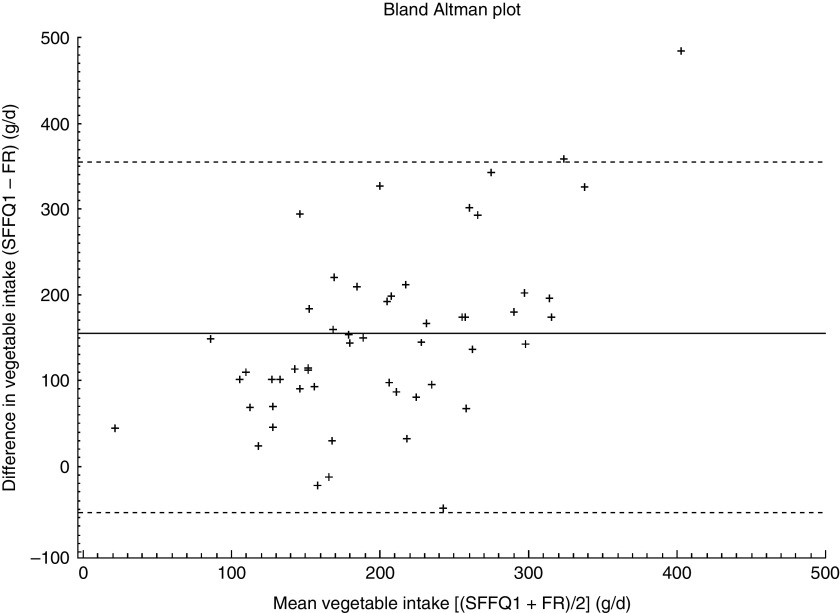
Fig. 1.
Bland–Altman plot assessing the relative validity of the parent-administered semi-quantitative FFQ (SFFQ) for assessing daily vegetable intake in Danish children aged 3–9 years (n 53), Capital Region and the Regional Municipality of Bornholm, Denmark, 2013. The difference in intake between the first administration of the SFFQ (SFFQ1) and the average of the 4 d estimated food records (FR) is plotted v. the mean intake from the two methods; —— represents the mean difference and – – – – – represent the 95 % limits of agreement corresponding to ±1·96 sd

