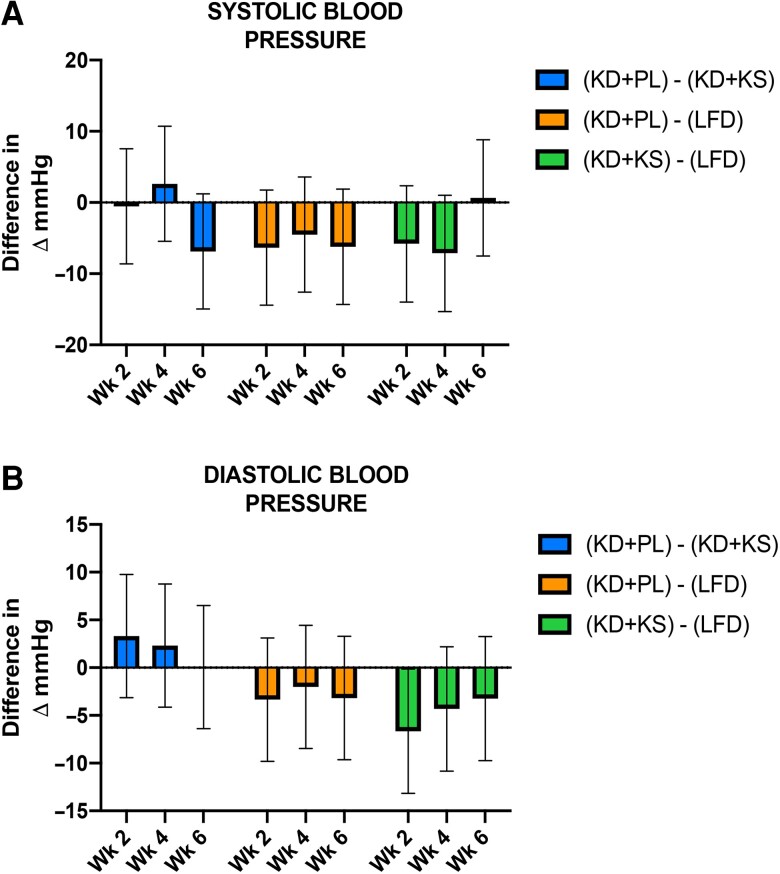
Figure 3.
Systolic (A) and diastolic (B) blood pressure between groups over 6 weeks. Linear mixed models with random intercept were used to explore the difference in the change in weight, systolic blood pressure, and diastolic blood pressure across time by different diet group controlling for sex and body mass index. For each measure, the differences of any 2-diet group and 95% CI within each time point are displayed.

