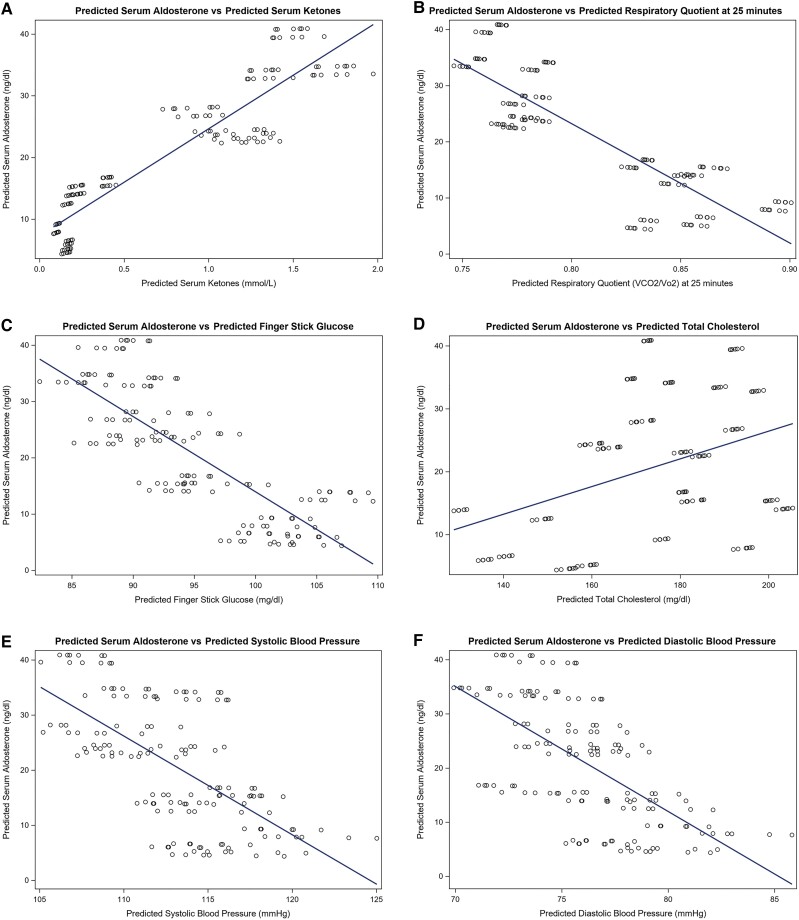
Figure 4.
(A-F) Predicted relationships between serum aldosterone and selected biomarkers over 6 weeks. Scatter plots were constructed to graphically illustrate relationships between average estimates for pairs of outcomes, for example there was a positive association between predicted Aldosterone with predicted ketones.

