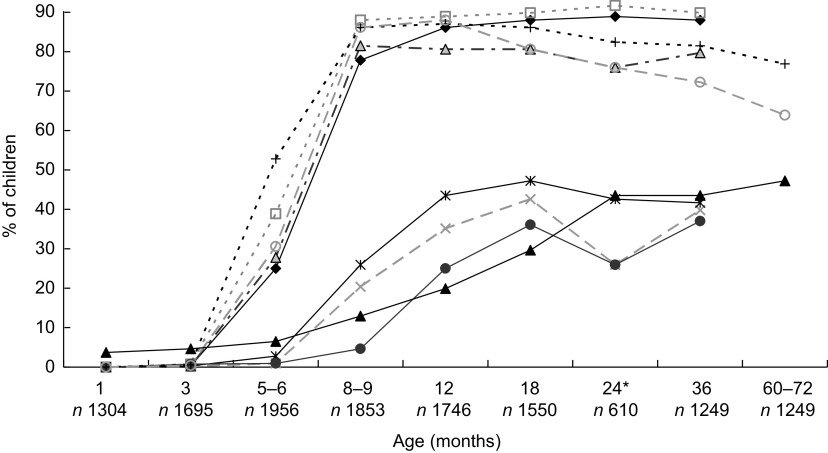
Fig. 3.
Consumption of different food groups (
 , milk products;
 , cereals;
 , meat;
 , fish;
 , pulses;
 , eggs;
 , fruit;
 , vegetables;
 , sugar-sweetened beverages), by age, among pre-school children (n 26 898; 32 915 well-child visits) from three regions of Italy (Friuli Venezia Giulia, Tuscany and Puglia), November 2008–August 2009. *Data refer only to Friuli Venezia Giulia

