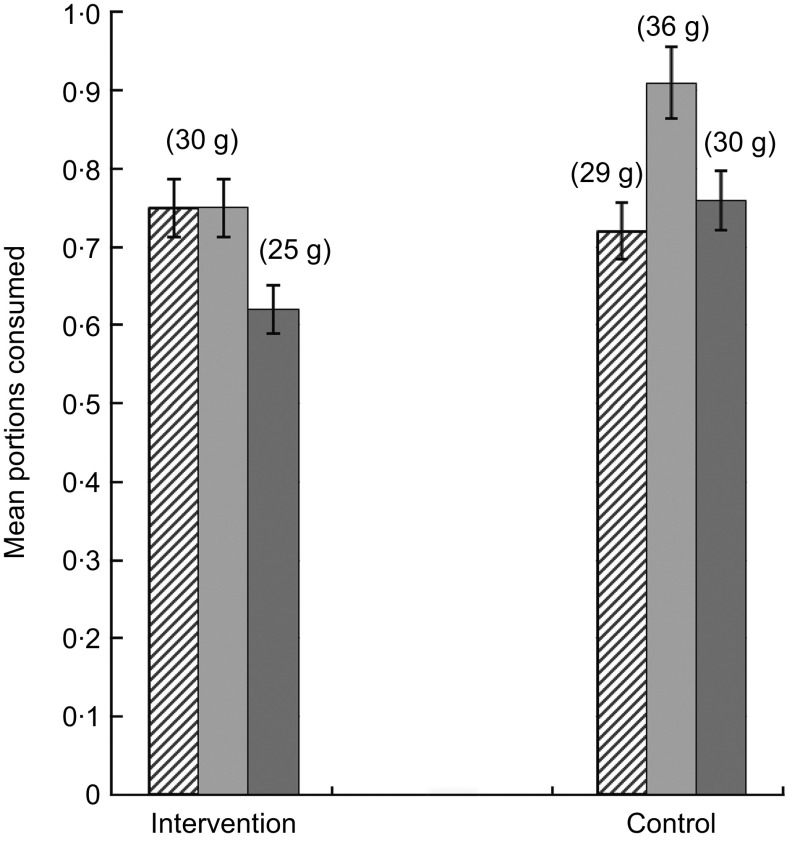
Fig. 2.
Portions of fruit and vegetables consumed at lunchtime (amount in grams in parentheses) in the intervention and control schools (home-provided meals) at baseline ( ), 3-month follow-up (
 ) and 12-month follow-up (
 ); primary-school children aged 4–11 years, Food Dudes programme, West Midlands, UK. Values are means with 95 % confidence intervals represented by vertical bars

