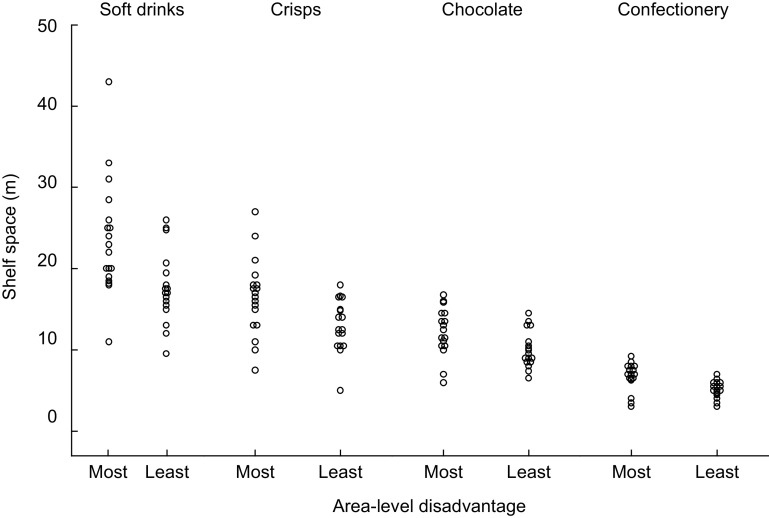
Fig. 1.
Shelf space (in metres, unadjusted for total store size) allocated to soft drinks, crisps, chocolate and confectionery in supermarkets (n 35) located in the most and least socio-economically disadvantaged areas in Melbourne, Australia, September–November 2010 and January–February 2011. Mean values (most disadvantaged v. least disadvantaged) and P values for comparison of means: 23·6 m v. 17·7 m, P = 0·006 for soft drinks; 16·5 m v. 13·0 m, P = 0·016 for crisps; 12·2 m v. 10·1 m, P = 0·022 for chocolate; 6·7 m v. 5·1 m, P = 0·003 for confectionery

