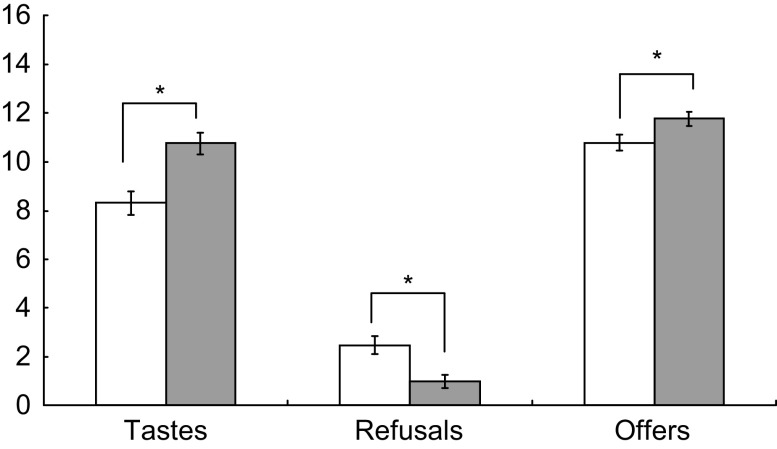
Fig. 2.
Number of days of taste exposure (tastes), refusals to taste (refusals) and offers of the vegetable by the parent (offers), for the EO (exposure only, n 58;
 ) and the E+R (exposure plus reward, n 57;
 ) groups, in a randomized controlled trial conducted among children aged 4–6 years and their primary caregiver/parent, Adelaide, South Australia. Values are means with their standard deviations represented by vertical bars. Mean values were significantly different between groups: *P < 0·05

