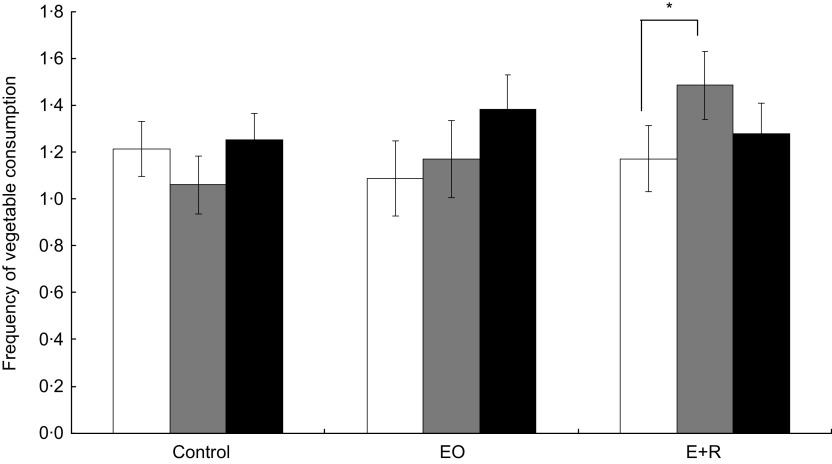
Fig. 7.
Frequency of vegetable consumption on the previous day at baseline (
 ), 4-week follow-up (
 ) and 3-month follow-up (
 ), for the control (baseline, n 63, 4 weeks, n 56; 3 months, n 57), EO (exposure only; baseline, n 34, 4 weeks, n 32; 3 months, n 34) and E+R (exposure plus reward; baseline, n 44, 4 weeks, n 40; 3 months, n 41) groups, in a randomized controlled trial conducted among children aged 4–6 years and their primary caregiver/parent, Adelaide, South Australia. Values are means with their standard errors represented by vertical bars. Mean values were significantly different between time periods: *P < 0·05

