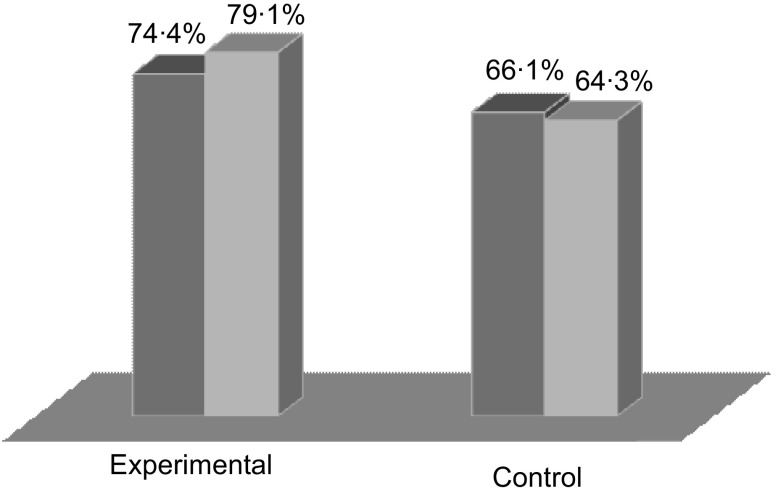
Fig. 3.
Comparison of the proportions of high-school students aged 12 to 17 years who stayed in school for lunch every day during the last ten school days, pre- ( ) and post-intervention (
 ), according to school (experimental, n 129; control, n 112); central Canada, September 2009 (pre) and May 2010 (post)

