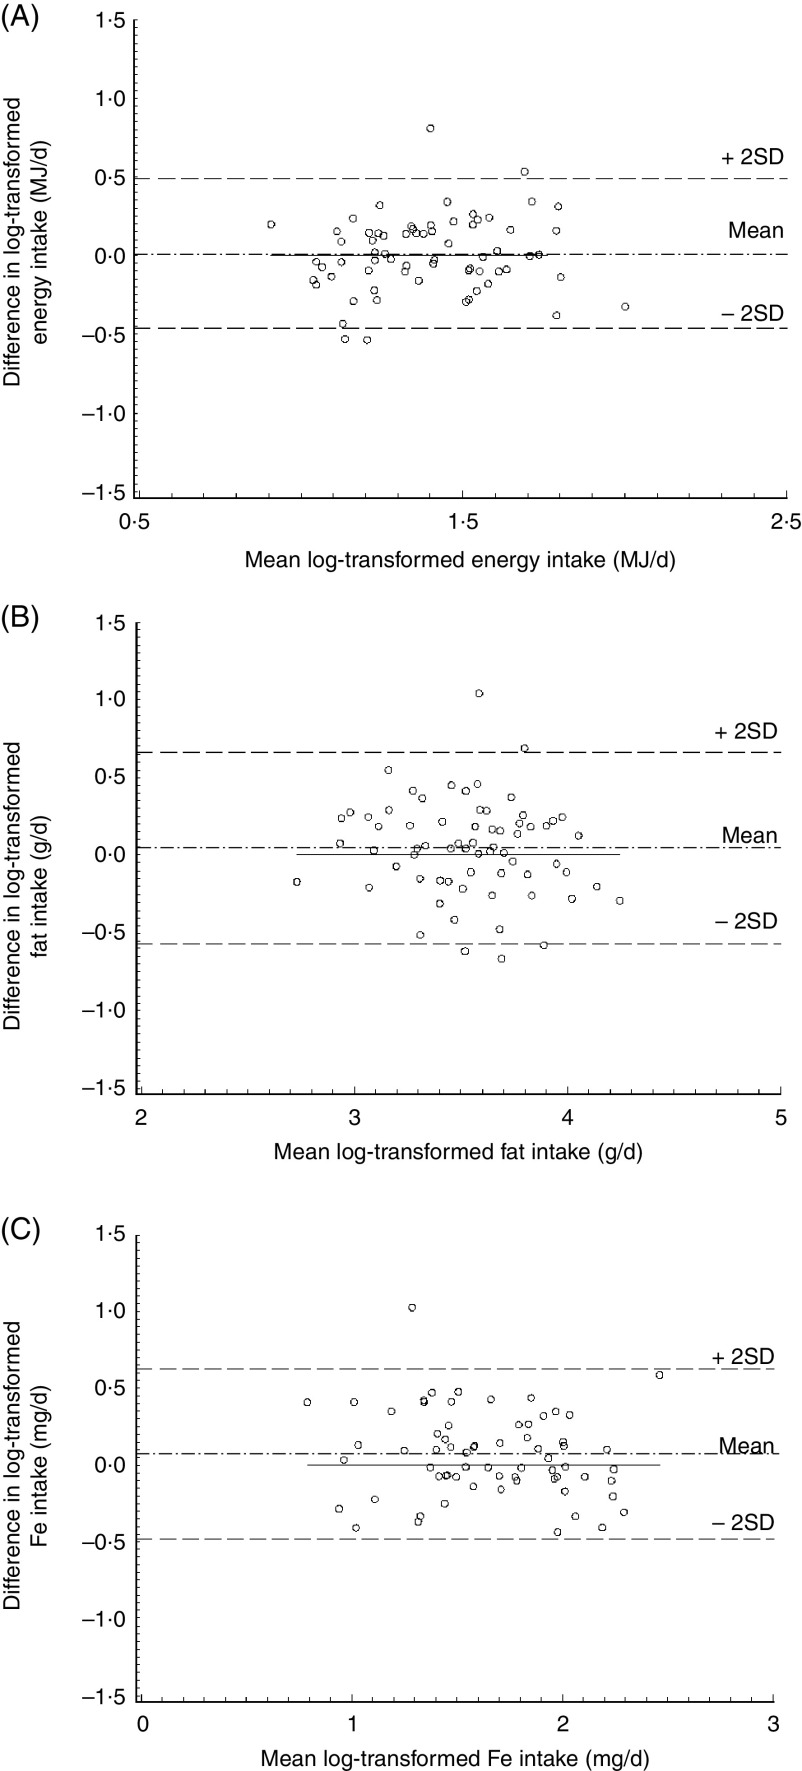
Fig. 3.
Bland–Altman plots of agreement between dietary intakes reported in the 3 d estimated food record (EFR, test method) and the 3 d weighed dietary record (WDR, reference method) in German toddlers aged 10 to 36 months (n 67): (A) energy intake (MJ/d); (B) fat intake (g/d); (C) iron intake (mg/d). Data are log-transformed values. The differences between dietary intakes calculated from EFR (test method) and dietary intakes estimated from WDR (reference method) for each participant (y-axis) are plotted against the mean dietary intakes averaged from the two methods (x-axis). — · — represents the mean of the differences; – – – (upper and lower) represent the upper and lower 95 % limit of agreement (mean±2 sd), respectively; —— represents the line of equality (y = 0). The Pearson correlation coefficient of the individual differences of dietary intakes between the two methods with the mean reported by the two methods was 0.12 (P = 0·3) for energy intake, −0.13 (P = 0·3) for fat intake and −0.14 (P = 0·3) for iron intake

