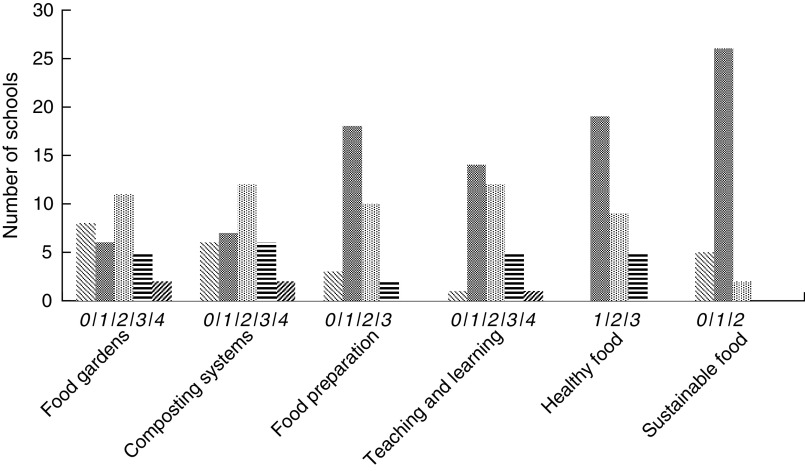
Fig. 1.
Distribution of scores ( , nothing happening (0);
  , just getting started (1);
  , up and running (2);
  , well used (3);
  , fully developed and integrated (4)) on the six food system environment domains of the School Food Environment Assessment Tools (SFEAT) for all schools (n 33)*, Vancouver, Canada. *n 32 for food gardens score

