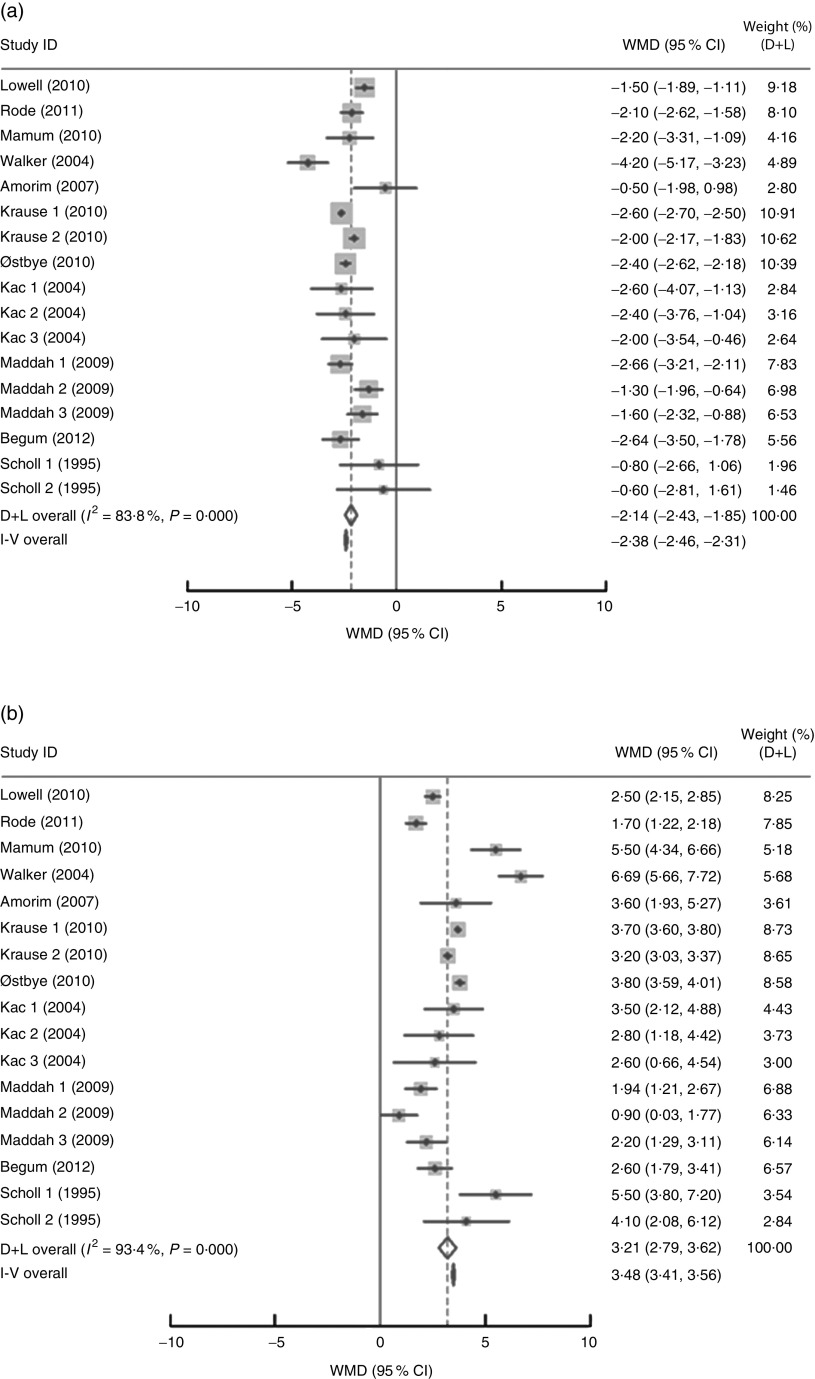
Fig. 2.
Pooled estimates for the weighted mean differences (WMD, kg) of postpartum weight retention between women who gained below (a) or above (b) and within the Institute of Medicine recommendation for gestational weight gain. The study-specific WMD and 95 % CI are represented by the grey square and horizontal line, respectively; the size of the data marker (grey square) is proportional to the weight of the study in the meta-analysis. The centre of the open diamond presents the pooled WMD and its width represents the pooled 95 % CI

