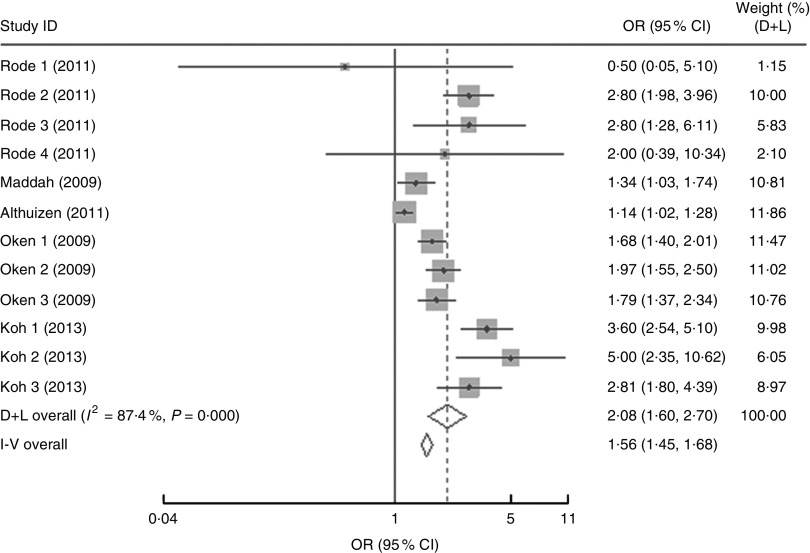
Fig. 3.
Forest plot of the studies on the risk of postpartum weight retention of ≥5 kg for the women with excessive gestational weight gain (GWG) v. the women with adequate GWG. The study-specific OR and 95 % CI are represented by the grey square and horizontal line, respectively; the size of the data marker (grey square) is proportional to the weight of the study in the meta-analysis (note: weights are from random-effects analysis). The centre of the open diamond presents the pooled OR and its width represents the pooled 95 % CI

