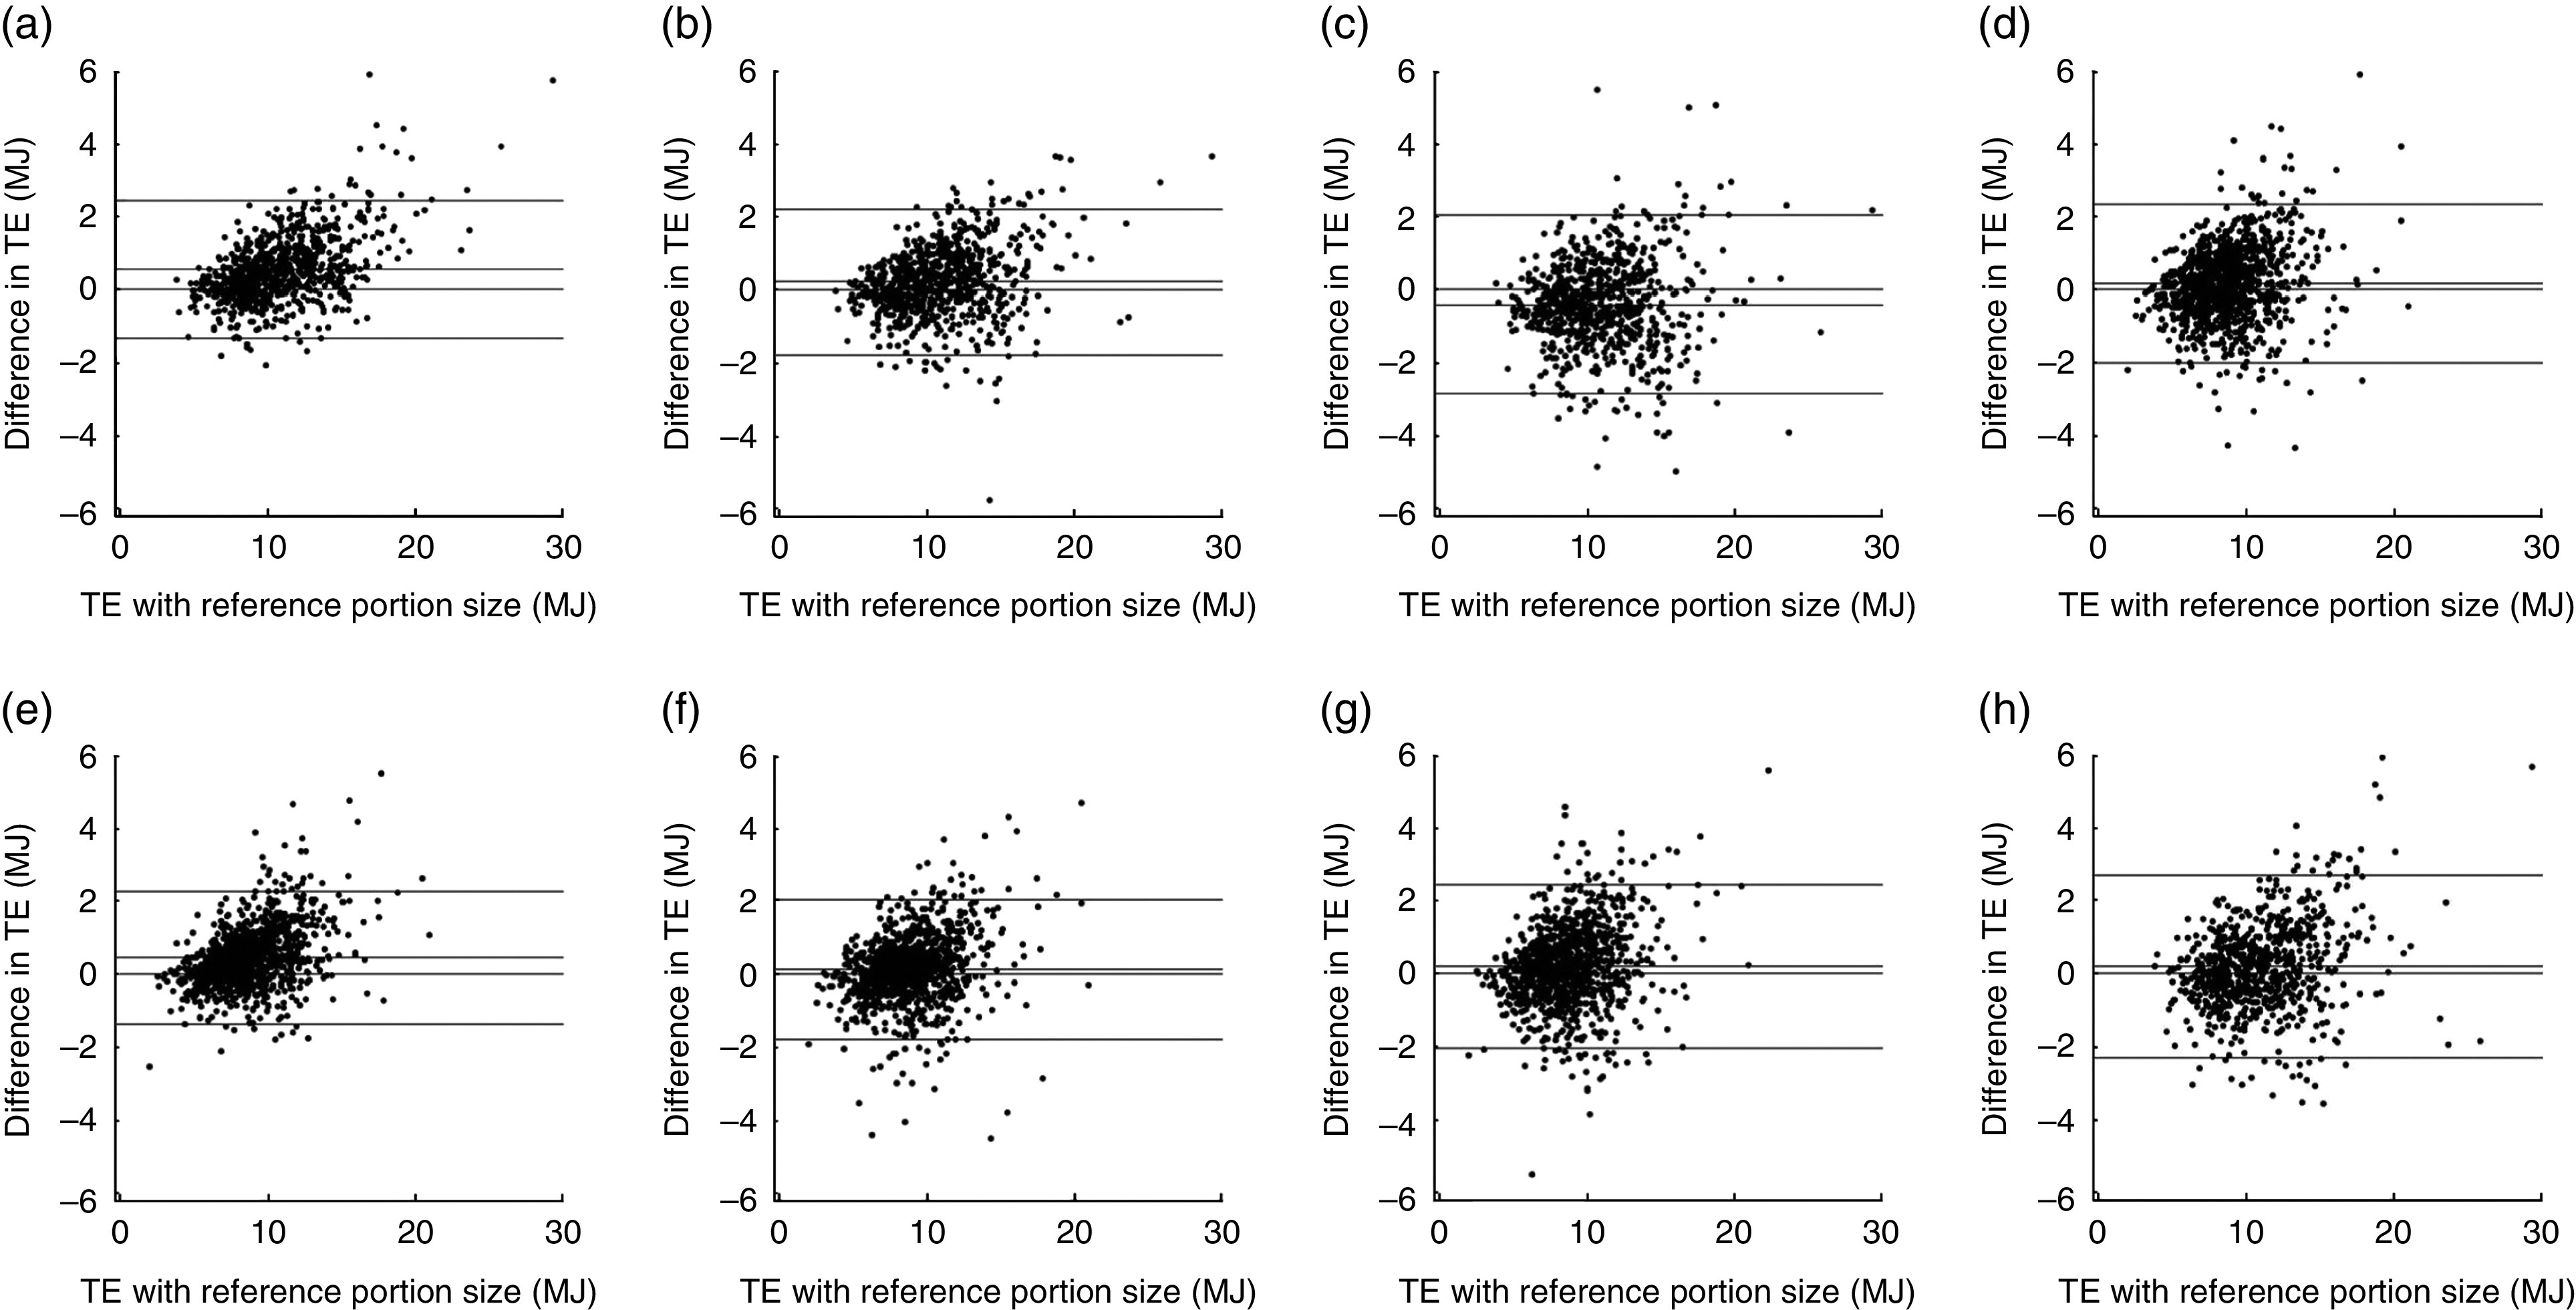
Fig. 1.

Total energy intake (TE) computed with the reference portion sizes (x-axis) is plotted against the difference between the reference TE and the TE computed with the portion sizes from each imputation method (y-axis): (a) median imputation in men (B=0·15, se=0·008, T=17·7); (b) MLR imputation in men (B=0·10, se=0·010, T=9·5); (c) KNN imputation in men (B=0·04, se =0·013, T=2·7); (d) Coca imputation in men (B=0·11, se=0·013, T=8·5); (e) median imputation in women (B=0·16, se=0·010, T=17·1); (f) MLR imputation in women (B=0·11, se=0.011, T=10·5); (g) KNN imputation in women (B=0·12, se=0·013, T=9·4); (h) Coca imputation in women (B=0·11, se=0·012, T=8·8). In this variation of a Bland–Altman plot, the x-axis denotes the reference value (and not the mean) as the error pertains solely to the imputed measure. The horizontal lines denote zero, the mean difference, +2 sd and −2 sd. B=the slope of a regression line: y=Bx+c. T=B/se; thus T denotes the tendency to underestimate portion sizes in subjects with high TE (and the reverse). High values of T denote stronger tendencies; the significance is implicit as T>1·95 implies P<0·05. Note: a positive value on the y-axis indicates an underestimation of the reference energy intake (imputation method: median, standard portion sizes, defined as sex-specific medians; MLR, multinomial logistic regression; KNN, k-nearest neighbours; Coca, ‘comparable categories’)
