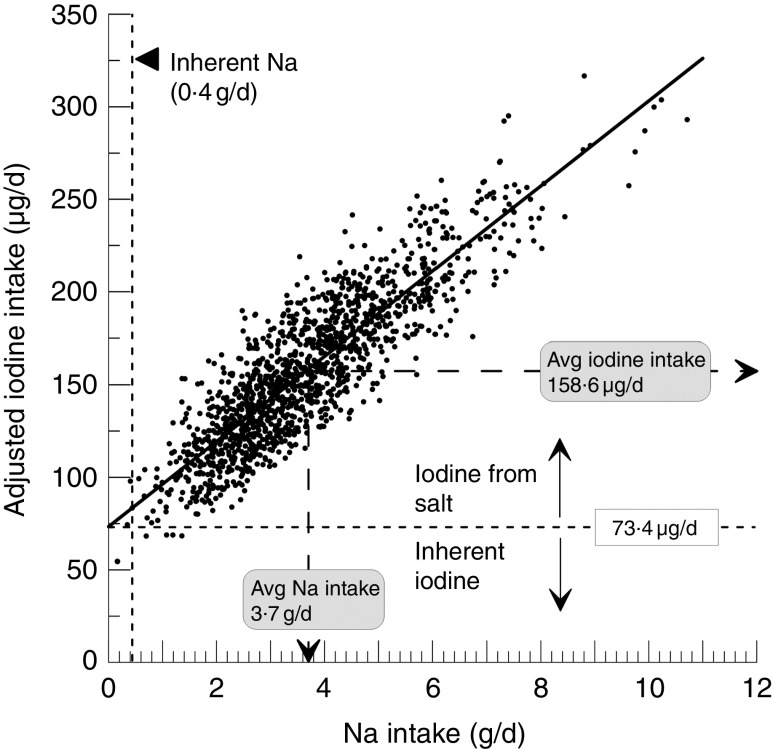
Fig. 2.
Regression line drawn on scatter diagram relating sodium excretion/intake and adjusted estimated iodine intake of the study population (random sample of residents ≥15 years of age (n 1420) from three different linguistic regions of Switzerland, 2010–2012): Iodine intake=73·4±1·3+3·66×23·0±0·34 (r=0·88). The intercept of 73·4 µg denotes the fraction of the total iodine intake that is inherent in food and does not depend on iodized salt. The complementary fraction to the total iodine intake represents the contribution from iodized salt. The fraction of inherent sodium was obtained from food supply data and the food composition database

