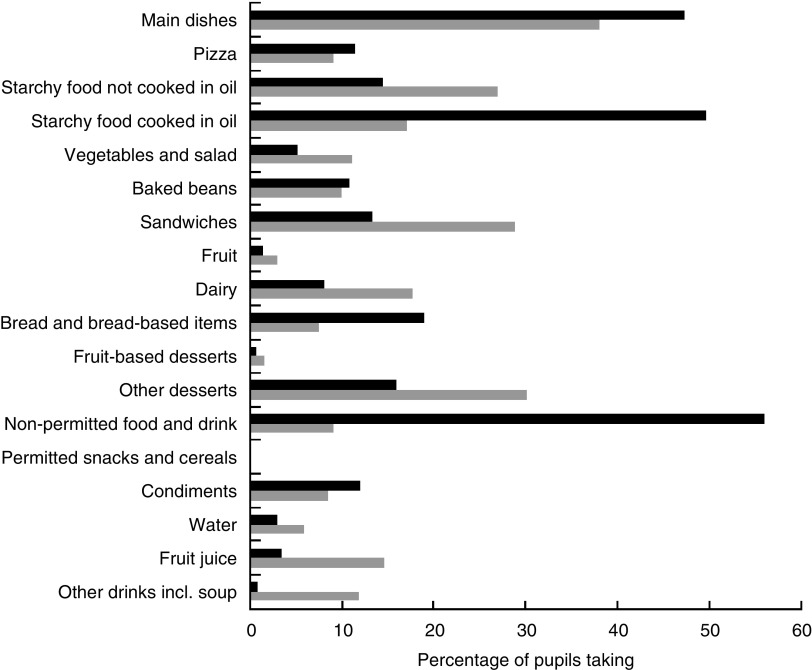
Fig. 1.
Percentage of pupils taking specific items of food and drink at lunchtime, by food group, secondary schools, England, 2004 (
 ) and 2011 (
 ). Base (pupils): n 5969 in 2011; n 5695 in 2004. All differences were statistically significant at P ≤ 0·001 except baked beans (P = 0·056) and permitted snacks and cereals (P = 0·474)

