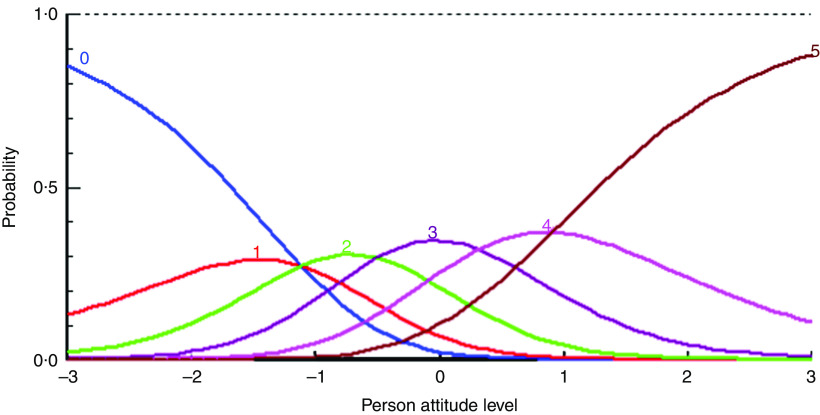
Fig. 1.
(colour online) The response category probability curves for item 69 of the engagement in dietary behaviour (EDB) scale. The curves marked 0–5 illustrate the probability of ticking off in each of the six response categories on the rating scale applied in the questionnaire as a function of the estimated attitude levels on the EDB scale. The line - - - - - is an asymptote (probability equals 1, i.e. 100 %)

