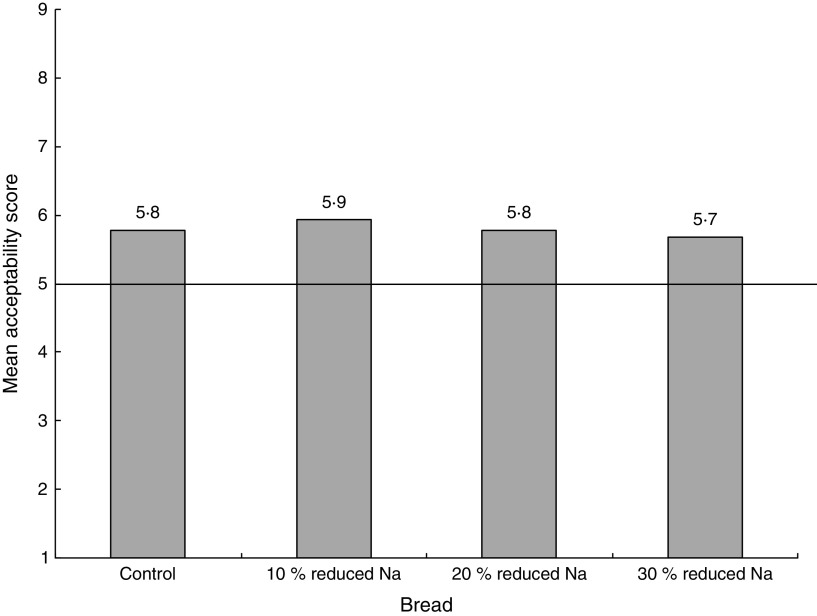
Fig. 1.
Mean acceptability scores for overall liking of bread with typical sodium content (control) and breads given a 10 %, 20 % and 30 % sodium reduction among consumers (n 109) in Oregon, USA, 2013. Acceptability was measured using a nine-point hedonic scale where 1 = ‘dislike extremely’ and 9 = ‘like extremely’; the horizontal line (———) represents an acceptability score of ‘neither like nor dislike’. A mean acceptability score above this line indicates that consumers, on average, liked the bread product

