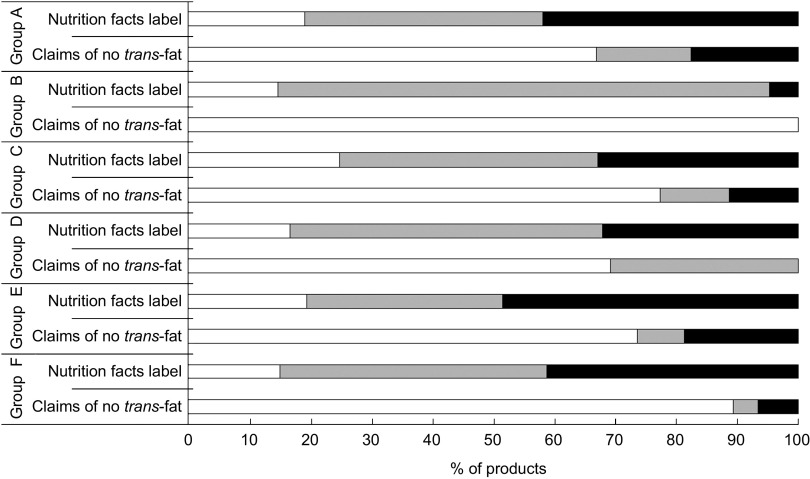
Fig. 1.
Percentage of products reporting trans-fat on the nutrition facts label and making claims of no trans-fat on the packaging and agreement of these data with the ingredient list, stratified by food group: processed food products (n 2327) available in a large supermarket in Florianópolis, Brazil, May 2010.  , with trans-fat;
  ,
,  , without trans-fat (
 , true negatives;
  , false negatives). Food groups: Group A = bakery products, grains and grain-based products; Group B = dairy; Group C = meat-based products; Group D = oils, fats and processed nuts; Group E = sugars, sugary foods and snacks; Group F = sauces, seasoning blends, stock cubes, dry soups and refrigerated/frozen dishes

