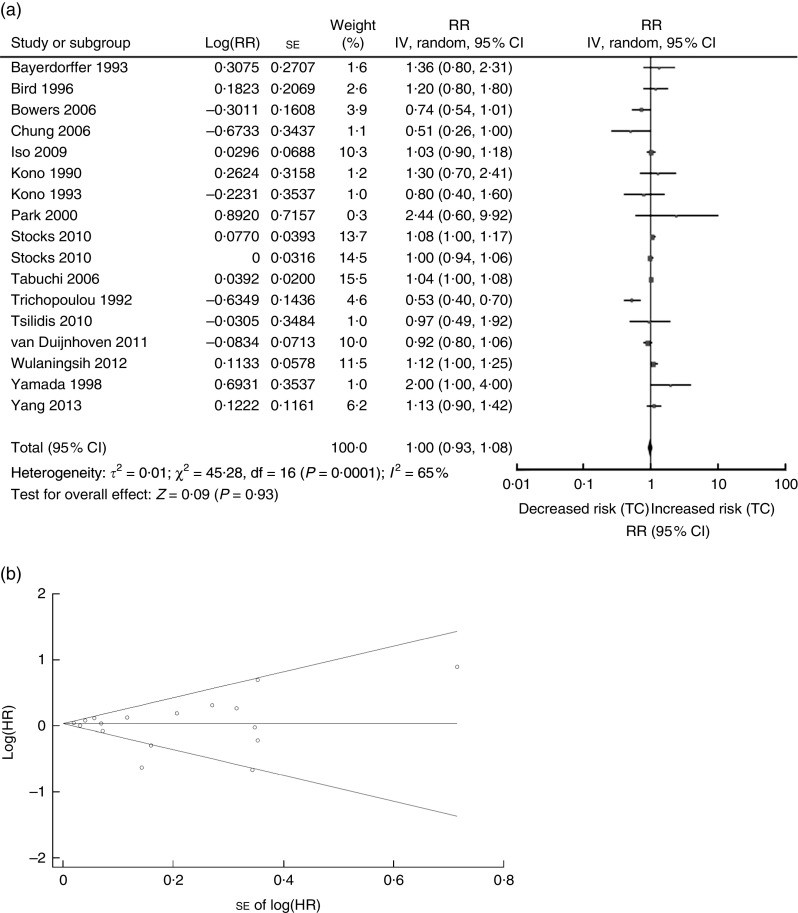
Fig. 1.
Association between TC and CRN (adenoma and cancer combined): (a) forest plot; (b) funnel plot. In (a), the study-specific RR and 95 % CI are represented by the black square and horizontal line, respectively; the area of the black square is proportional to the specific-study weight to the overall meta-analysis. The centre of the diamond presents the pooled RR risk and its width represents the pooled 95 % CI. In (b), Begg’s funnel plot with pseudo 95 % CI is presented (TC, total cholesterol; CRN, colorectal neoplasm; RR, risk ratio; IV, fixed-effects model; HR, hazard ratio)

