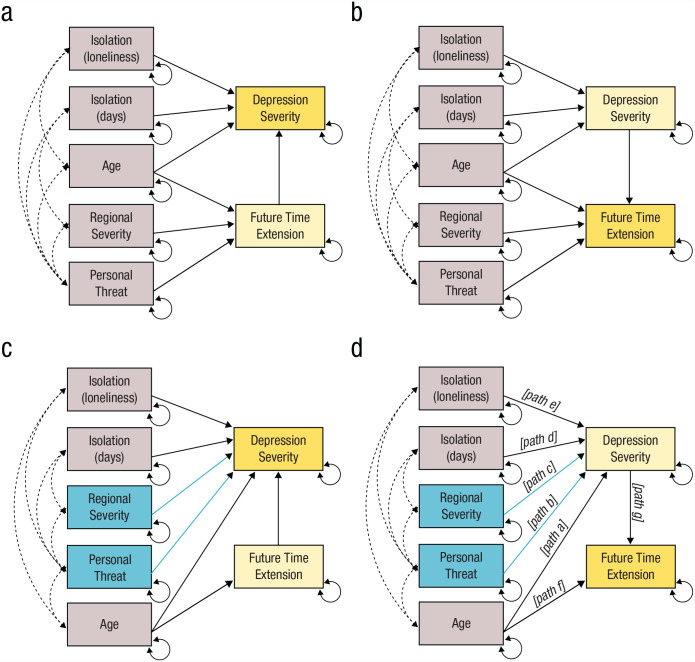
Fig. 1.
Path diagrams of models specified as hypothesized and respecified following optimization. In all models, single-headed arrows represent regression paths and their directionality, dashed double-headed arrows represent correlated error terms, and solid double-headed arrows indicate residual error. Variables on the left-hand side of each model (gray/blue) are exogenous predictors. Variables on the right-hand side are both endogenous and exogenous (light yellow) or fully endogenous (dark yellow). The hypothesized (a) depression-severity model (the Patient Health Questionnaire [PHQ] model) and (b) future time extension (FTE) model included paths from regional severity and personal threat to FTE; chronological age was thought to predict both FTE and depression severity (PHQ), and the two isolation indices were modeled as predictors of depression severity. The PHQ and FTE models were respecified (c and d, respectively) so that regional severity and personal threat predicted depression severity (blue paths). Path labels have been added in (d) for clarity.

