
Figure 6:
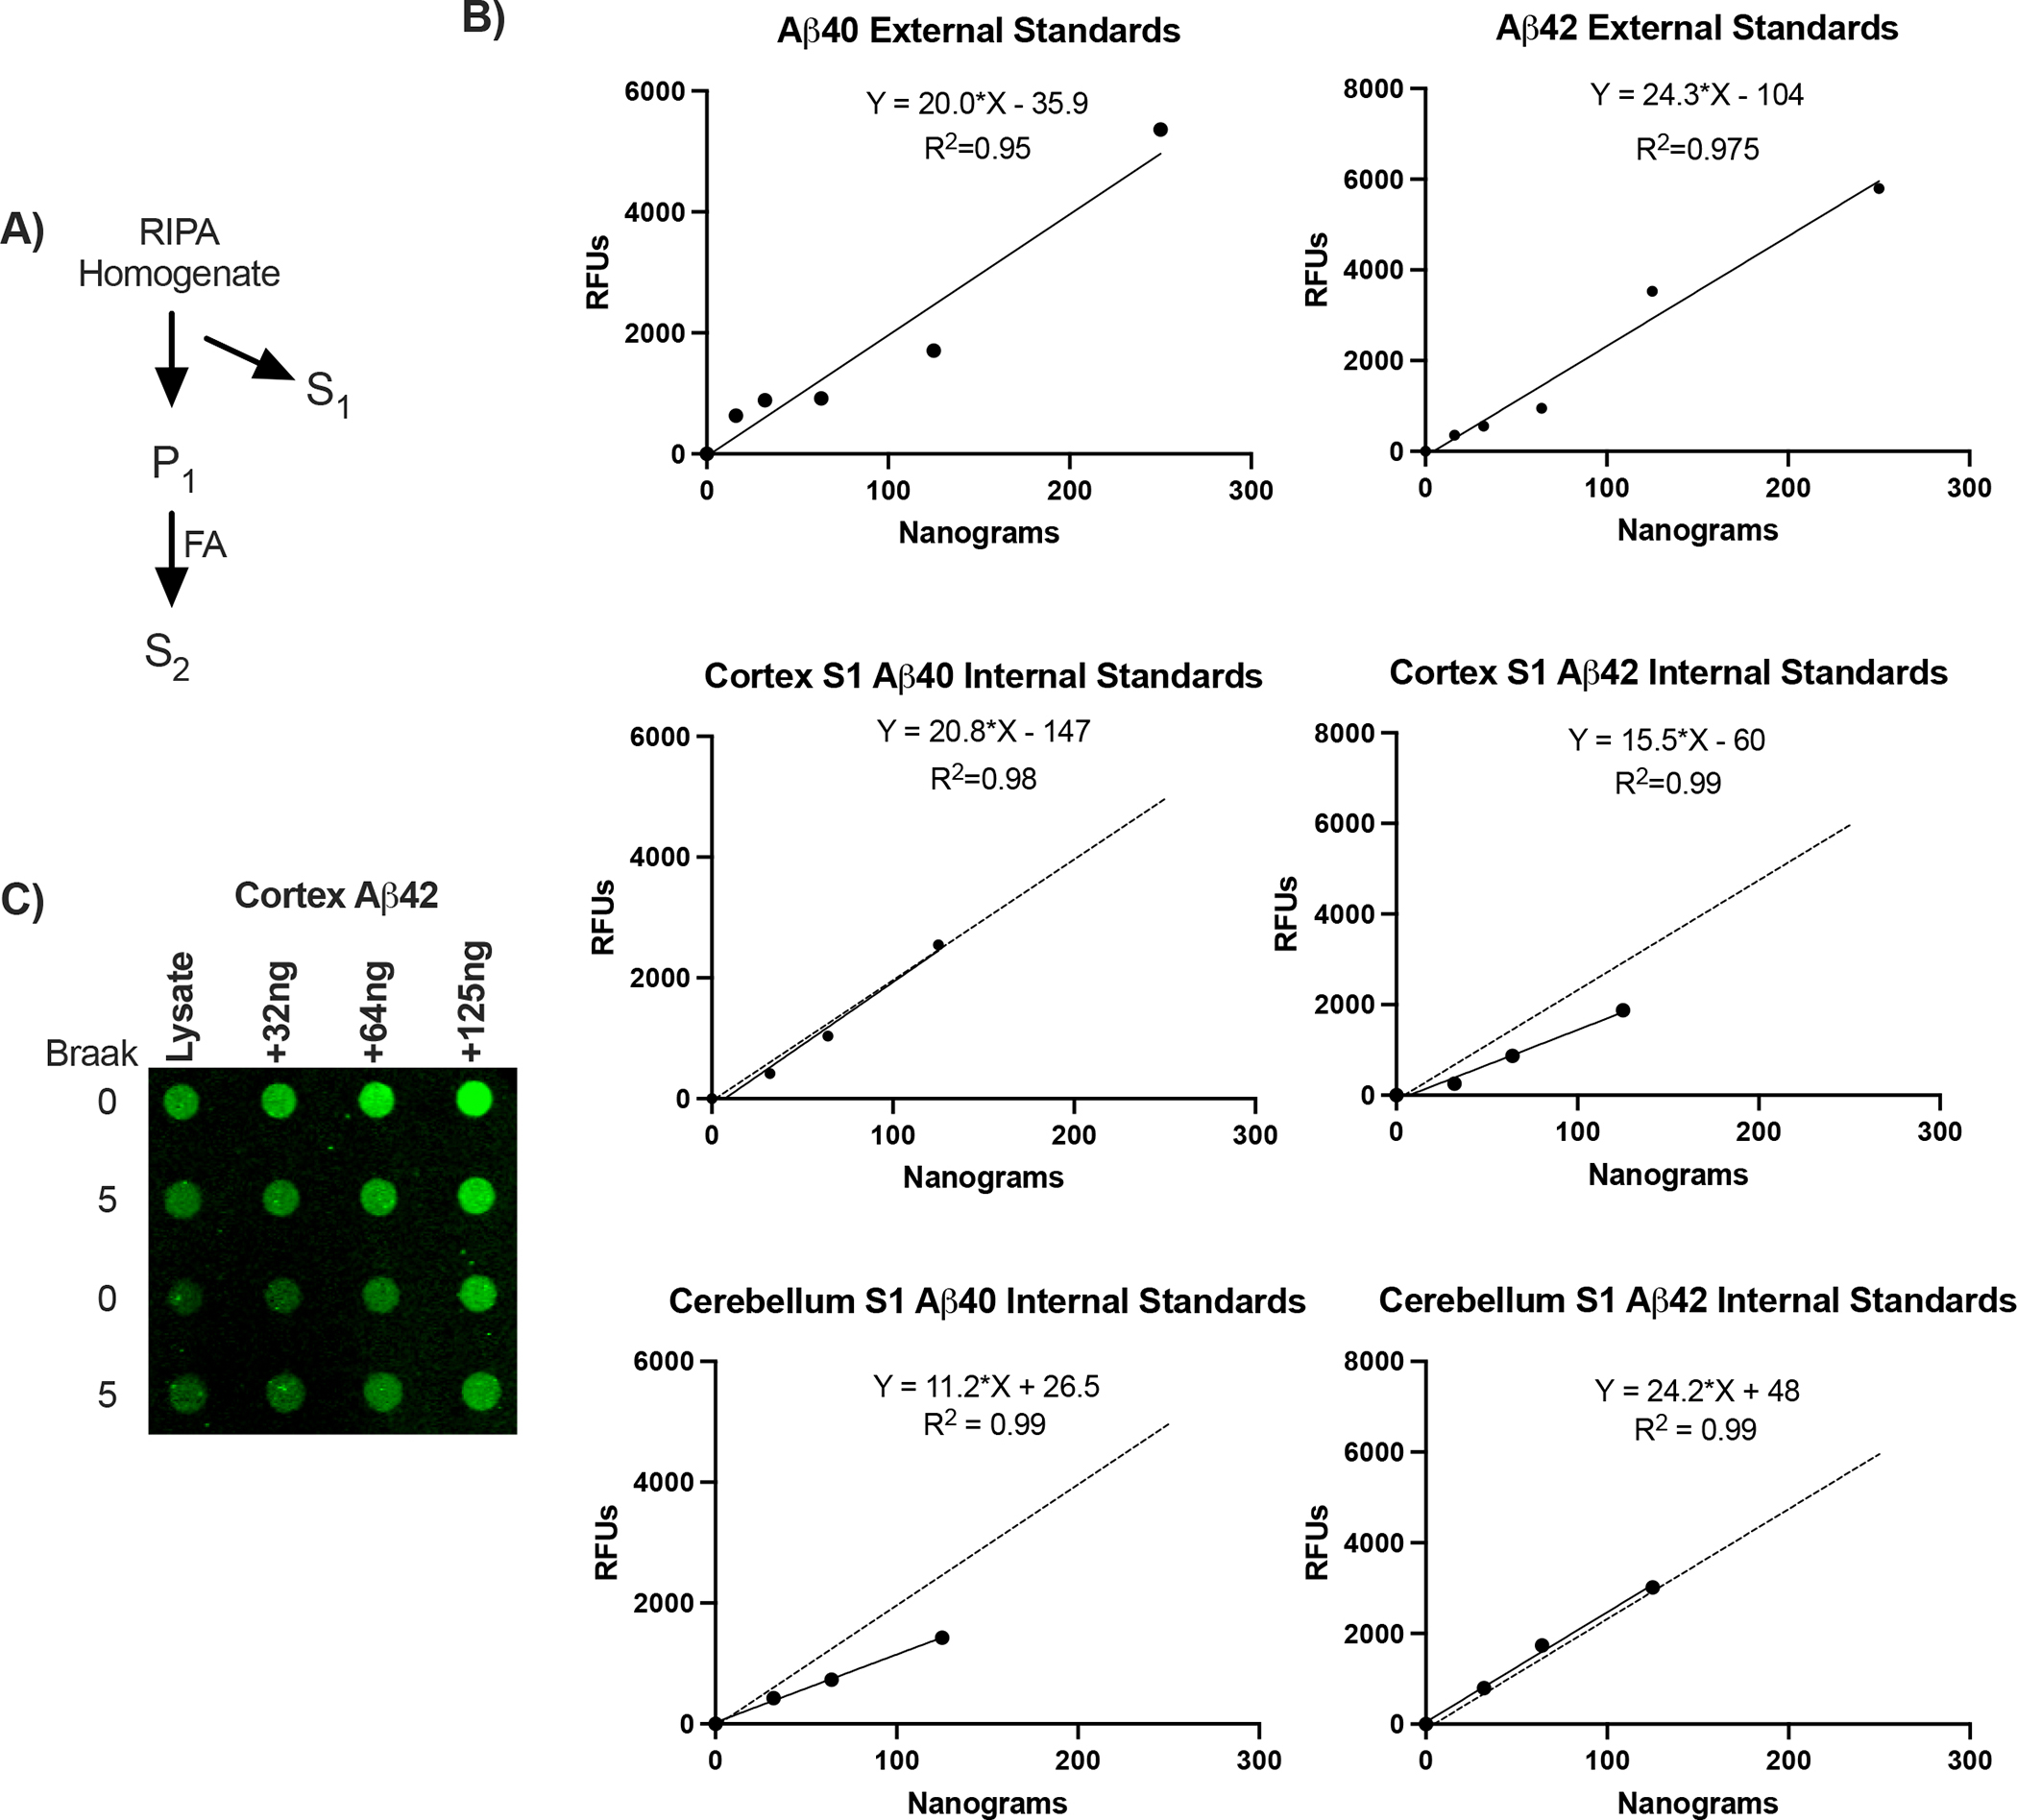
β-Amyloid peptide standard curves. A) Diagram of amyloid extraction and fractionation. S1, RIPA soluble amyloid; P1, insoluble pellet. S2, formic acid solubilized (FA). B) Standard curves for reagent Aβ40 and Aβ42 are linear for 100-fold range of relative fluorescence units (N, 6–8 per curve). C) Representative dot blot for internal standard curves of Aβ42 added to S1 lysates of cortex.